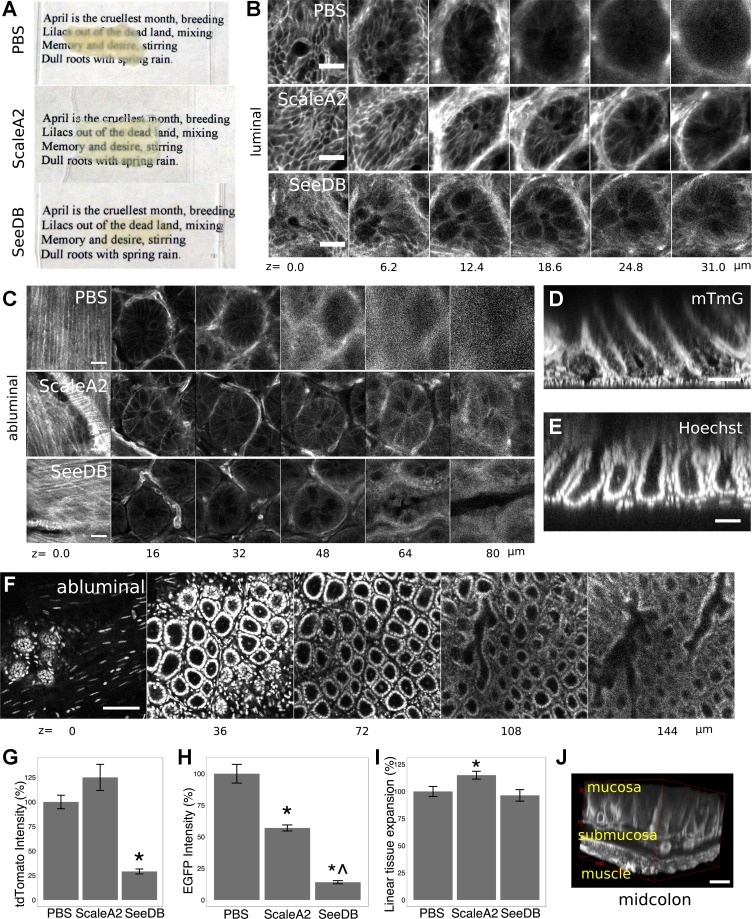
Fig. 2.
ScaleA2 and SeeDB clear murine colorectal tissue. A–C: usage of ScaleA2 and SeeDB improved optical penetration through colorectal mucosal tissue, evaluated macroscopically (A) and microscopically in luminal (B) and abluminal (C) images showing native, membrane-localized tdTomato fluorescence from mTmG mice. The source tissue for SeeDB clearing in A was not as large as the control tissue in x-y size. D and E: abluminal images were used to generate orthogonal projections showing the axial resolution of tdTomato (D)- and Hoechst (E)-labeled structures. F: tissue was sufficiently cleared (shown: ScaleA2) to permit visualization of cellular nuclei from the base to the top of the colonic crypt in abluminal images. G and H: use of SeeDB caused a partial loss of membrane tdTomato fluorescence in mTmG mice (G), and both ScaleA2 and SeeDB caused partial loss of cytoplasmic enhanced green fluorescent protein (EGFP) fluorescence in Lgr5::EGFP-IRES-CreERT2 mice (H). Fluorescence comparisons were made by longitudinally cutting the colon into 3 strips, treating the strips with clearing agents or PBS, and then comparing crypt fluorescence in equivalent proximal-distal regions. I: tissue incubated in ScaleA2 expanded, as measured by comparing crypt cross-sectional areas in equivalent colonic regions. *P < 0.05, t-test, vs. PBS; ^P < 0.05, t-test, vs. ScaleA2. J: 3-dimensional (3D) reconstruction shows the SeeDB-cleared muscle and mucosal layers of midcolon. Error bars: SE. Scale bars: 20 (B and C), 50 (D and E), 100 (F), and 50 (J) μm. Nominal z-positions indicate depth from either the luminal surface (top of the crypt, luminal images) or the basilar plane (crypt base and submucosa, abluminal images).

