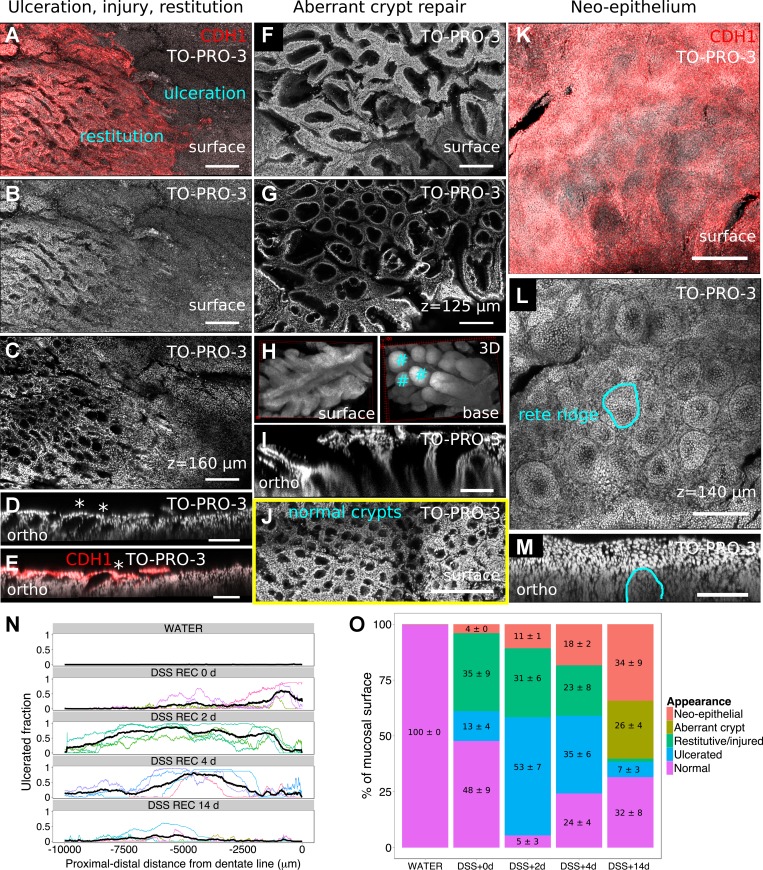
Fig. 6.
DMI captures reproducible epithelial structures during mucosal healing. A–D: restitutive and glandular changes are present at the boundary of ulceration, marked by the red edge of CDH1+ cells in A. Nuclei-only surface reconstruction and a deeper z plane are shown in B and C, both demonstrating the loss of crypt architecture. Separate digitally reconstructed orthogonal images show that the luminal openings of crypts are occluded by cells (D, *) and that these occluding cells are CDH1+ (E, *). F–I: aberrant crypt repair structures are prominent in late-stage recovery, as shown in surface (F) and subsurface (G) images. 3D projections (H) show that these structures provide a common luminal opening for collections of nascent crypts (exemplar crypts are marked with #), which is also demonstrated in the orthogonal image (I). J: surface reconstruction of morphologically normal crypts is shown for comparison. K–M: the most-distal colonic region was repaired with a neoepithelial sheet, which had a CDH1+ surface (K) and a subsurface structure resembling rete ridges (L). A single ridge is highlighted in the orthogonal image (M). N: the profile of ulceration could be recorded from multiple mice (colored lines) and averaged (black line); the results agreed with a general resealing of the epithelial surface by both more-proximal colonic and distal squamous-like epithelium. O: the average abundance of described structures changed over the time course of DSS recovery, with restitutive features being prominent early and aberrant crypts appearing late. Nos. on graph indicate average percent surface area ± SE for prominent (≥4%) epithelial features (n = 4 mice/cohort). Because of rounding, some nonzero error measurements are reported as 0. Scale bars: 200 (A–C), 100 (D and E), 200 (F and G), 100 (I), 200 (J), 200 (K and L), and 100 (M) μm. Clearing, SeeDB.

