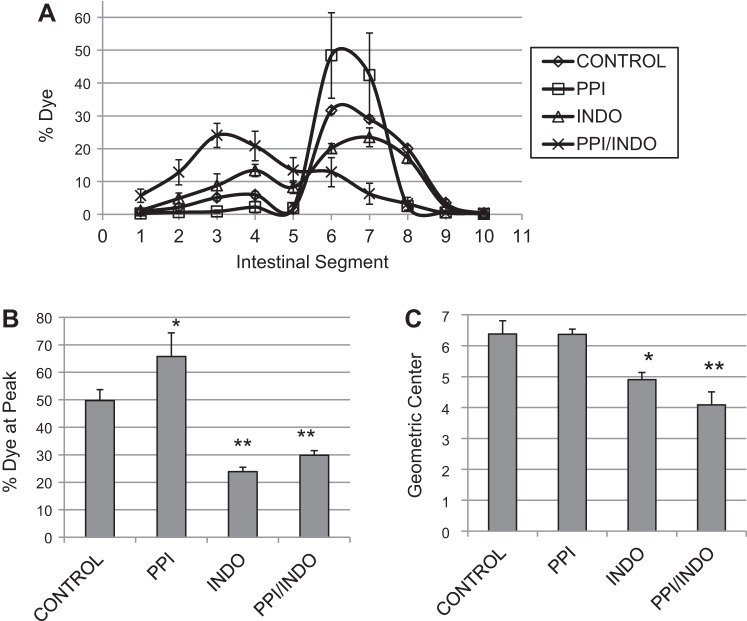
Fig. 3.
Intestinal transit measured by propagation of nonabsorbable FITC-dextran dye through the small intestine is shown. A: average dye per intestinal segment for each treatment group. B: percent dye at the peak segment for each treatment group. C: calculated geometric center reflecting the speed of intestinal transit for each treatment group. Means ± SE are shown; n = 6 per group; *P < 0.05; **P < 0.005.

