
Figure 4.
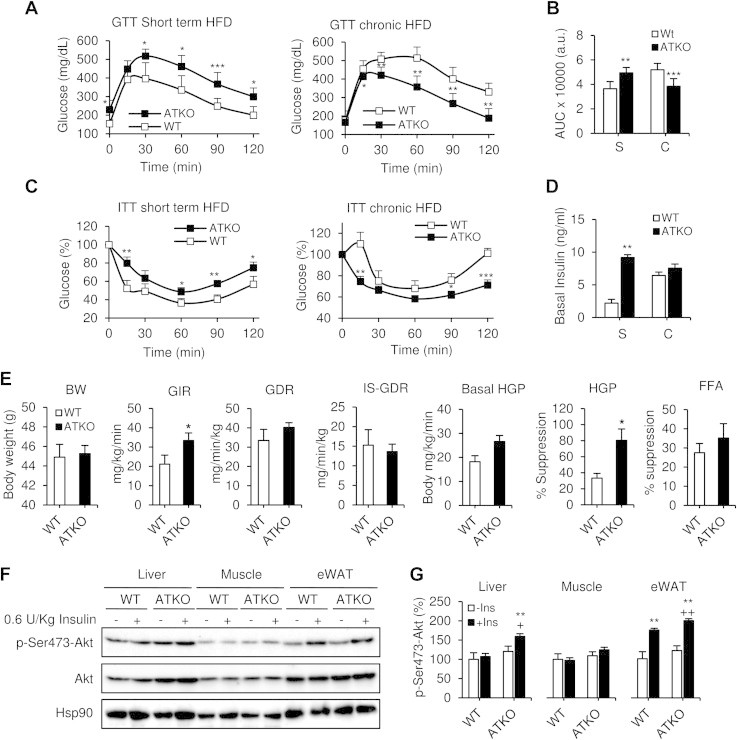
Dual effect of Sirt1 deficiency in adipose tissue during HFD. Short term vs. chronic effects. A, C: Intraperitoneal glucose tolerance tests (IP-GTT; 1 g/kg) and intraperitoneal insulin tolerance tests (IP-ITT; 0.6 U/kg) during short term HFD feeding (S, 5 wks; n = 10–12 per group) and chronic HFD feeding (C, 15 wks; n = 10–12 per group). B, D: Area under curve (AUC) and basal insulin levels from previous GTTs. Values are expressed as means ± SEM (*P ≤ 0.05, **P ≤ 0.01 and ***P ≤ 0.001 vs. WT at the same time point). E: Hyperinsulinemic-euglycemic clamp study in chronic HFD-fed mice (15 weeks). BW, Body weight. WT and ATKO matched body weights of mice during clamp studies. GIR, glucose infusion rate during hyperinsulinemic-euglycemic clamp. GDR, Glucose disposal rate. IS-GDR, insulin-stimulated glucose disposal rate. Basal-HGP, basal hepatic glucose production rate. HGP-Suppression, percent suppression of HGP. FFA, Free fatty acid suppression. Values are expressed as means ± SEM (*P ≤ 0.05 vs. WT; n = 5/6 mice per group). F: Western blot showing acute insulin-stimulated phosphorylation of AKT in liver, muscle and eWAT from chronic HFD-fed mice. Hsp90 expression was used as loading control. The western blot shown is representative of four independent experiments. G: Densitometry analysis and ratio of phospho-Ser473-Akt/total Akt from F. Values are expressed as means ± SEM (*P ≤ 0.05 **P ≤ 0.001 vs. WT basal. +P ≤ 0.05; ++P ≤ 0.001 vs. ATKO basal).