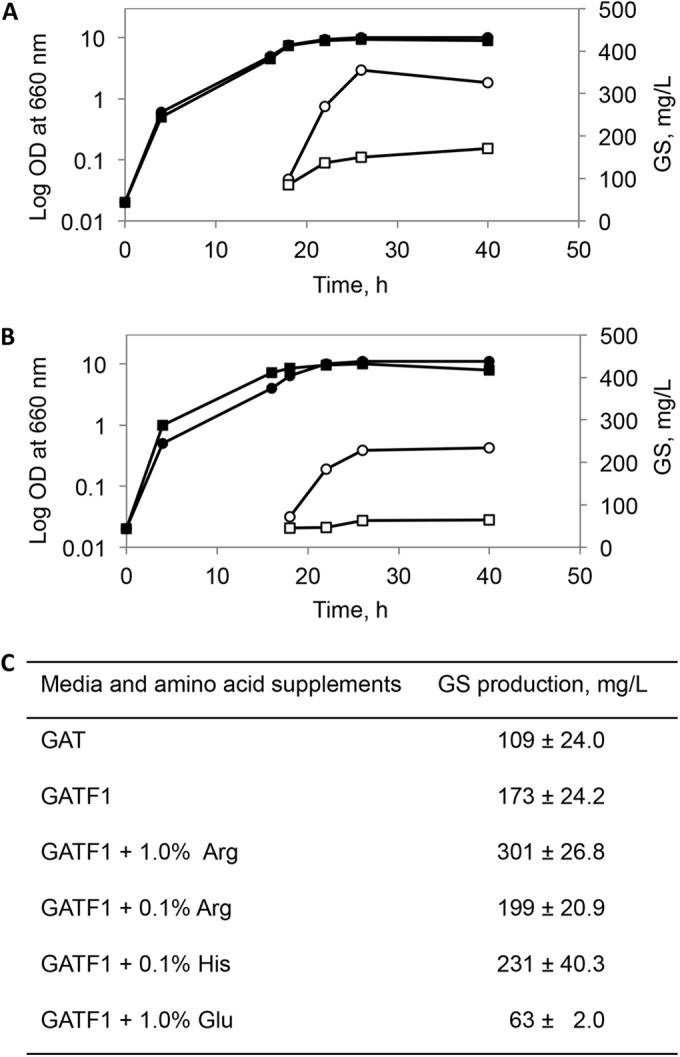
FIG 3.

Growth and GS production in GATF1 medium supplemented with selected amino acids. Monitoring of growth (filled signs, left axis) and GS production (empty signs, right axis) in the presence of 1% arginine (circles) and 0.1% arginine (squares) (A) and in the presence of 0.1% histidine (circles) and 1% glutamate (squares) (B). The curves presented are mutually comparable, since they belong to one set of experiments in which the cultures were inoculated with the same cell suspension. (C) Mean values of the maximal GS production as an average over several independent experiments (for GAT and GATF1, n = 6; for GATF1 with 1% glutamate and GATF1 with 1% arginine, n = 2; for GATF1 with 0.1% histidine and GATF1 with 0.1% arginine, n = 5).
