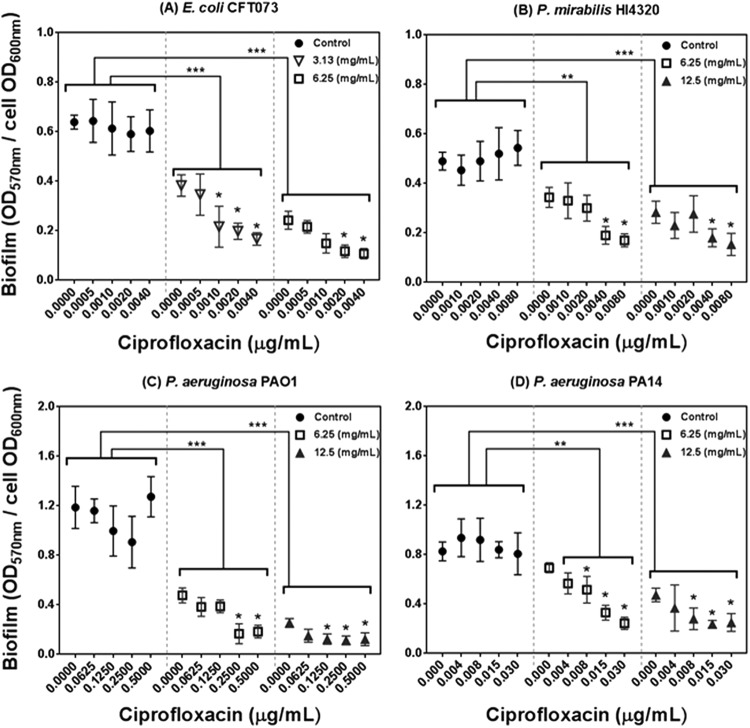
FIG 1.
Effect of PRMSE with and without ciprofloxacin on biofilm formation of E. coli CFT073 (A), P. mirabilis HI4320 (B), P. aeruginosa PAO1 (C), and P. aeruginosa PA14 (D). The graph presents normalized biofilm levels (OD570/OD600) versus different subinhibitory concentrations of ciprofloxacin for each strain grown in LB medium (control) or in LB medium amended with subinhibitory concentrations of PRMSE (3.13, 6.25, and 12.5 mg ml−1). Error bars show the standard deviations from values obtained from three replications. Statistically significant differences are indicated for each sample treated with PRMSE and ciprofloxacin compared to the control (sample treated with the corresponding concentration of ciprofloxacin only) (**, P < 0.01; ***, P < 0.001) and also for samples treated with PRMSE plus ciprofloxacin compared to sample treated with the same concentration of PRMSE without ciprofloxacin (*, P < 0.05). The legend in each graph shows the concentration of PRMSE.

