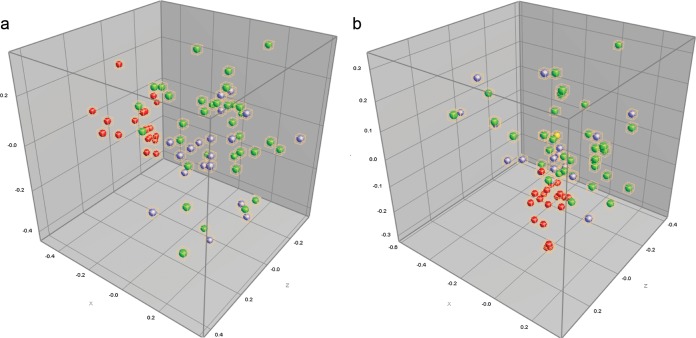
FIG 5.
AscI multidimensional scaling in three dimensions in the coordinate space (a), followed by ApaI multidimensional scaling in three dimensions (b). Samples from the rural watershed (MR) are green/yellow, while samples from the urban watershed (LF) are represented by purple symbols. NS human food-borne outbreak isolates are indicated in red. The proportion of the data variance (r2) accounted for by MDS was 0.72.

