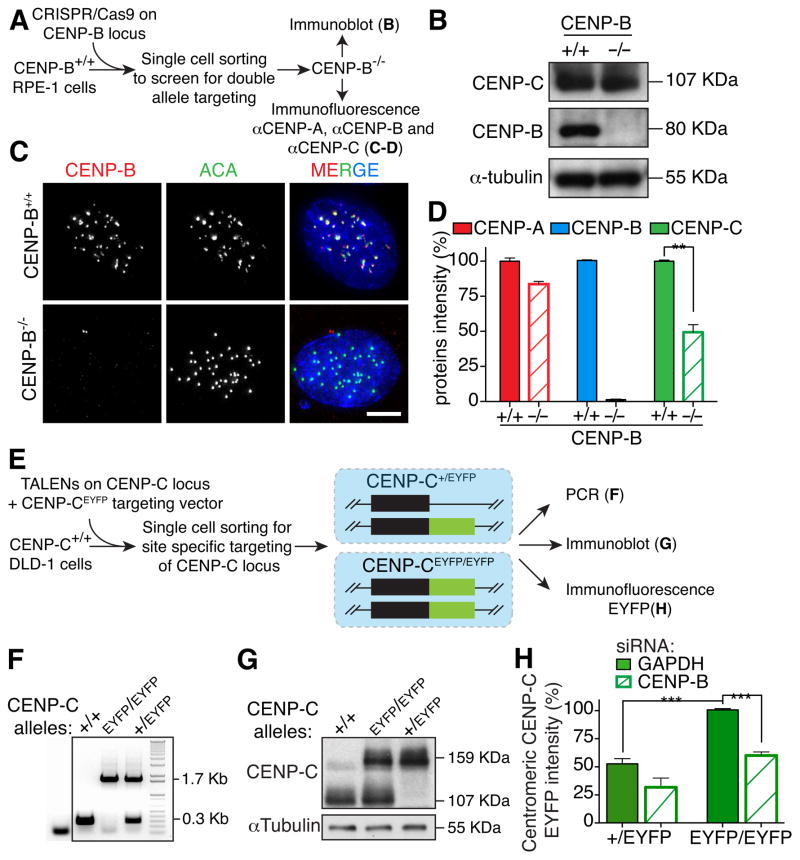
Figure 2. CENP-B is required for full CENP-C maintenance at centromeres.
(A) Schematic of the experiments described in B–D with the use of CRISPR/Cas9-mediated gene deletion (B) Immunoblot for accumulated CENP-B and CENP-C after identification of cells with both CENP-B alleles disrupted by action of the CRISPR/Cas9. α-tubulin was used as a loading control. (C) Representative immunofluorescence images of centromere-bound CENP-B following CRISPR-mediated disruption of both CENP-B alleles in RPE1 cells. ACA was used to mark centromere positions. Scale bar = 5 μm. (D) Bar graphs of centromere intensities for CENP-A (red), CENP-B (blue) and CENP-C (green) in the indicated cell lines quantified with specific antibodies as described in A. Bars represent the mean of three independent experiments (> 30 cells per experiment). Error bars represent the SEM. Unpaired t test: ** p < 0.006. (E) Schematic of the experiments described in F–H with the use of TALENs-mediated gene targeting. (F) CENP-C genotypes validated in the indicated cell lines using PCR to distinguish normal (+/+), double tagged (EYFP/EYFP), and single tagged (+/EYFP). (G) Immunoblot for CENP-C to distinguish non-tagged, single or double allele tagged CENP-C with EYFP. (H) Bar graphs represent CENP-C-EYFP centromeres intensity in the indicated cell lines measured by live cell imaging with or without siRNA treatment of CENP-B. Bars represent the mean of three independent experiments (> 30 cells per experiment, average of 30 centromeres for cell). Error bars represent the SEM. Unpaired t test: *** p < 0.0001. See also Figure S2.

