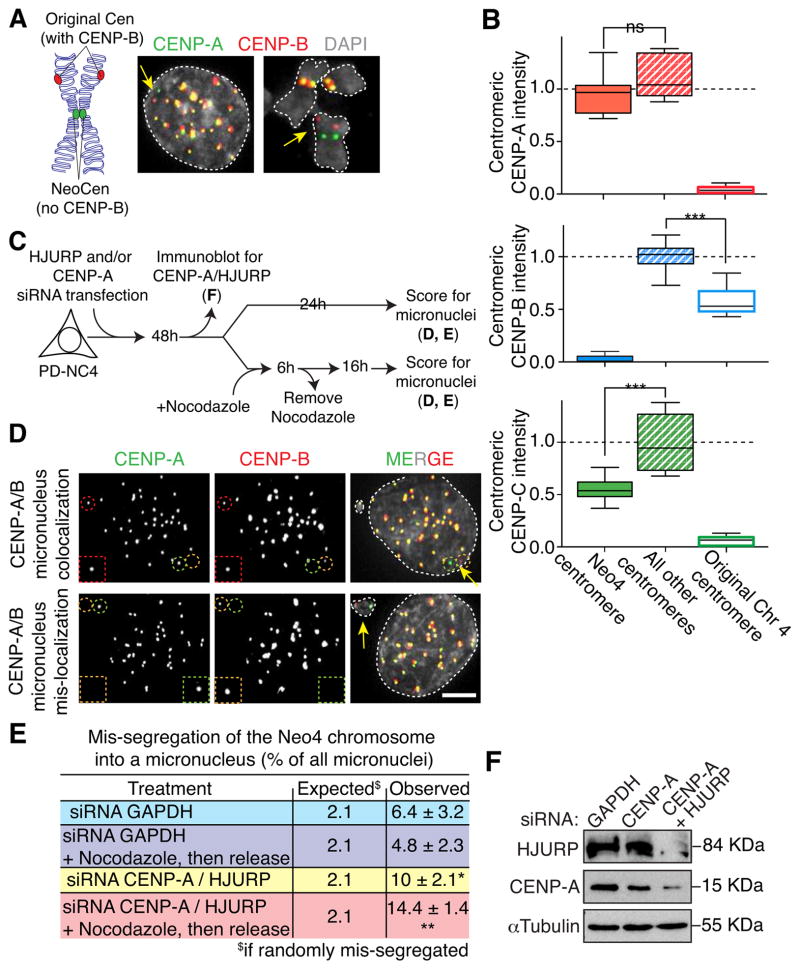
Figure 5. CENP-B is required for faithful chromosome segregation of the neocentromere chromosome.
(A) (Left) Schematic of the neocentromere-containing Neo4 chromosome from PD-NC4 cells. (Right) Representative immunofluorescence images of the neocentromere chromosome in interphase or mitosis (yellow arrows). (B) Box & whisker graphs of CENP-A, CENP-B or CENP-C intensities at the neocentromere (NeoCen), other chromosomes (All other Cens) and the original chromosome 4 measured on metaphase spreads (see Experimental Procedures for details). Error bars represent the SEM. Bar in the box represents the median; the whiskers represent cells distribution. Unpaired t test: *** p < 0.0001. (C) Schematic of the experimental design for testing frequency of micronuclei formation after siRNA treatment to reduce CENP-B or HJURP in PD-NC4 cells with the Neo4 neocentromere, followed by nocodazole-induced mitotic arrest, and subsequent recovery. (D) Chromosome missegregation rates of the Neo4 chromosome or other chromosomes, determined by immunofluorescence. Representative immunofluorescence images of centromere-bound CENP-A and CENP-B after siRNA treatment against GAPDH. Yellow arrows, green and orange circles/squares indicate the neocentromere chromosome, red circles/square a normal chromosome encapsulated in micronuclei. Scale bar = 5 μm. (E) Quantitation of expected and experimentally determined mis-segregation rates from D for the Neo4 chromosome. The observed mis-segregation rate is the frequency with which the Neo4 was found inside micronuclei relative to the total number of micronuclei. The frequency of micronuclei formation was determined by immunofluorescence after the indicated siRNA treatment and, when indicated, following recovery from nocodazole-induced mitotic arrest. Unpaired t test: * p < 0.04, ** p < 0.006. (F) Immunoblot of PD-NC4 cell extracts to measure total CENP-A and HJURP levels after siRNA treatment. α-tubulin was used as a loading control.

