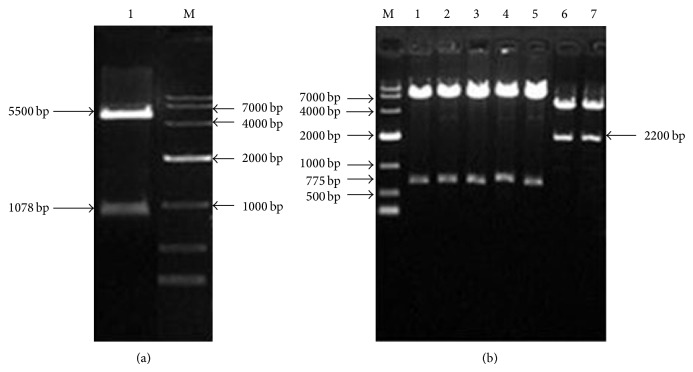
Figure 7.
Verification of restriction analysis of CYP3A4-promoter-Luc, CYP2B6-promoter-Luc, and CYP2C9-promoter-Luc: (a) is enzyme digestion analyses with Kpn I and Hind III of CYP3A4-promoter-Luc (M is DNA Marker DL10,000 and 1 is 1078 bp DNA band of CYP3A4); (b) is enzyme digestion analyses of CYP2B6-promoter-Luc and CYP2C9-promoter-Luc (M is DNA Marker DL10,000, 1, 2, 3, 4, 5 are 775 bp DNA bands of CYP2C9, and 6, 7 are 2200 bp DNA bands of CYP2B6).

