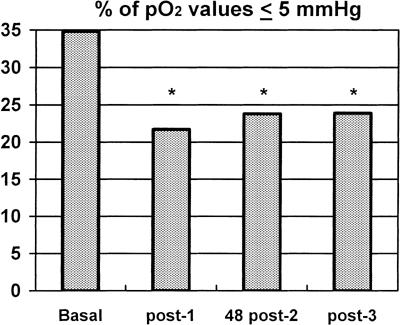
Figure 1.

Change in percentage of pO2 values ≤5 mmHg. During ozone therapy, a decrease in percentage of pO2 values ≤5 mmHg at each measurement time-point was observed in the tumors of patients: Baseline = before ozone therapy; post-1 = after session #1 (P = 0.002); 48 post-2 = 48 h after session #2 (P = 0.045); post-3 = after session #3 (P = 0.033). Significant differences (P < 0.05) are indicated with an asterisk (*)
