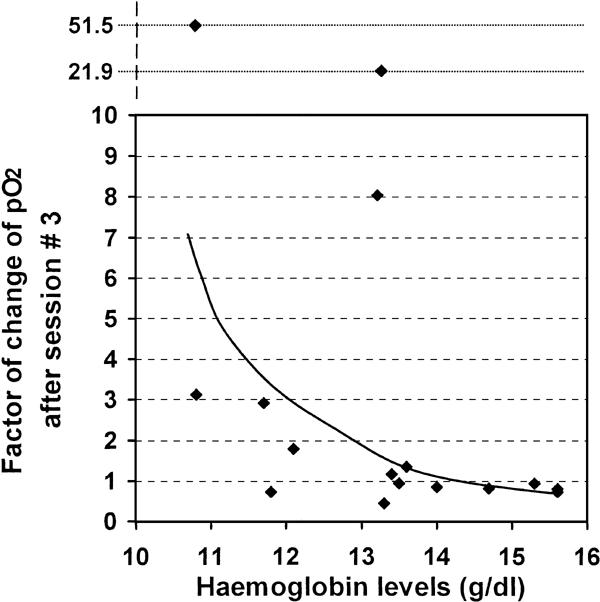
Figure 4.

Factor of change of pO2 (ΔpO2) after session #3 and hemoglobin levels. There was an inverse and non-linear correlation between hemoglobin levels and the ΔpO2 at each measurement time-point following ozone therapy, i.e., a lower effect of ozone therapy was observed in patients with higher hemoglobin levels. The figure shows the correlation with the ΔpO2 after session #3 (rho = −0.579, P = 0.019).
