Fig. 2.

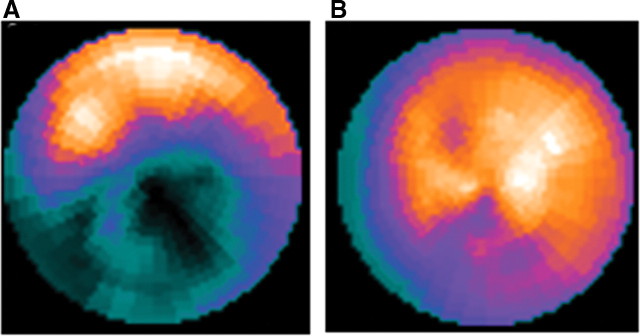
(A) Cardiac 123I-MIBG uptake and (B) 201Tl uptake 1 year after transplantation. The coloured areas indicate isotope uptake and black areas show the absence of isotope uptake. The blue areas indicate a reduction of isotope uptake.

(A) Cardiac 123I-MIBG uptake and (B) 201Tl uptake 1 year after transplantation. The coloured areas indicate isotope uptake and black areas show the absence of isotope uptake. The blue areas indicate a reduction of isotope uptake.