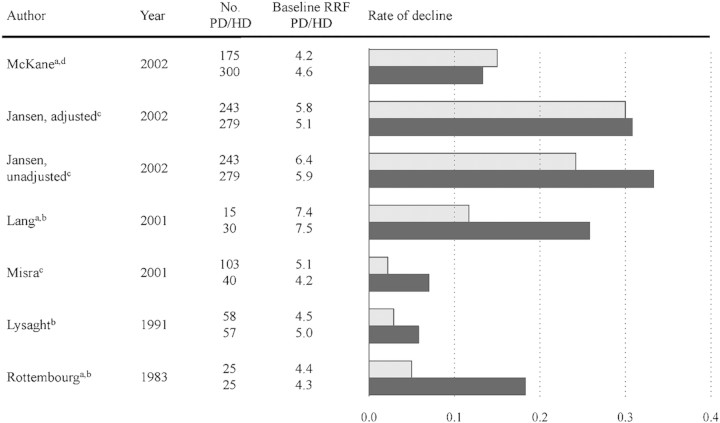
Fig. 2.
Decline of RRF in PD (gray bar) and HD (black bar) patients during the first 12 months of dialysis treatment. Baseline RRF and rate of decline are measured in milliliter per minute and milliliter per minute per month, respectively. aDecline rates are not given in the article but calculated from residual renal function values at baseline and 12 months. bRRF estimated as creatinine clearance. cRRF estimated as (creatinine and urea clearance)/2. dRRF estimated as urea clearance.

