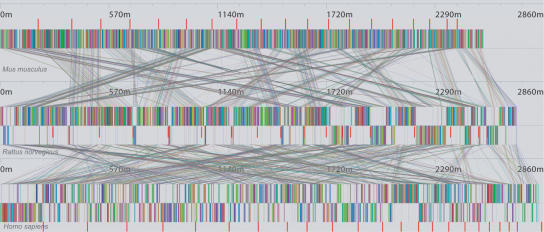
Figure 7.
Mauve visualization of locally collinear blocks identified between concatenated chromosomes of the mouse, rat, and human genomes. Each of the 1251 blocks has a minimum weight of 90. Red vertical bars demarcate interchromosomal boundaries. The Mauve rearrangement viewer enables users to interactively zoom in on regions of interest and examine the local rearrangement structure. The computation consumed ∼12 h on a 1.6-GHz workstation with 2.5 GB of memory.

