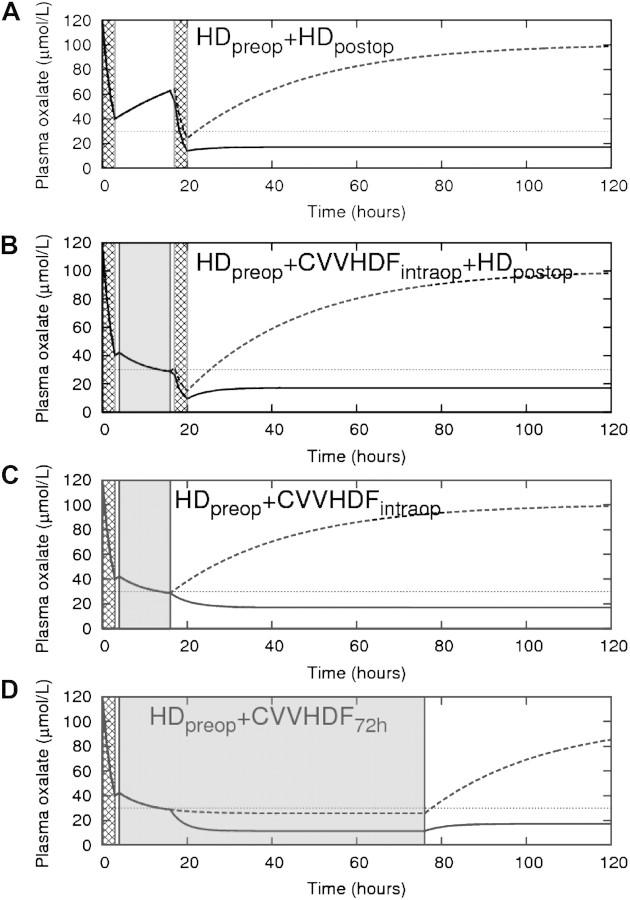
Fig. 3.
Plasma oxalate levels for different dialysis strategies. The x-axis denotes the time from the start of the preoperative HD session. The hatched areas indicate HD sessions (duration 3 h each); the shaded grey area indicates CVVHDF treatment. In panel (B) and (C), the duration of CVVHDF was 12 h (during LKT); in panel (D), CVVHDF was continued for an additional 72 h after the end of LKT. The solid line indicates plasma oxalate levels in the case of immediate renal transplant function; the dotted line indicates plasma oxalate levels in the case of absent renal transplant function.

