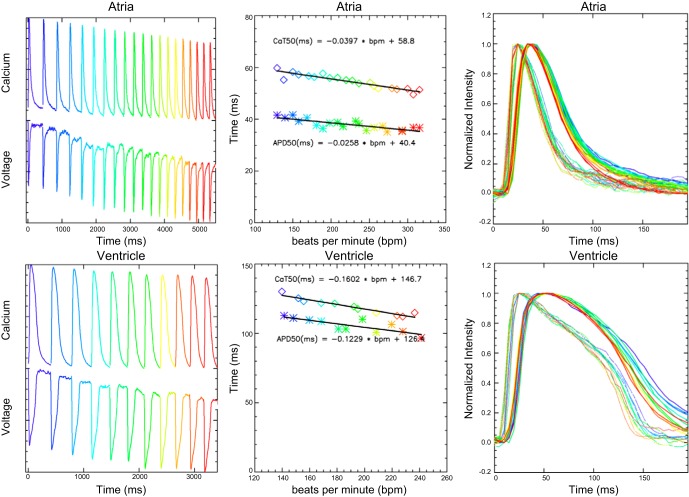
Fig. 11.
Variable rate stimulation. Top row left: atrial voltage and calcium recordings without baseline compensation, in which the rate of electrical stimulation increases by 10 beats/min per cycle. Line and plot symbol colors indicate heart rate values. Top row middle: atrial action potential (APD50) and calcium transient (CaT50) durations from 50% upstroke to 50% down stroke as a function of stimulation rate. For the APD50 fit r2 = 0.81 and for the CaT50 fit r2 = 0.93. Top row right: superimposed atrial voltage and calcium cycles with colors indicating heart rate. Bottom row left: ventricular voltage and calcium recordings. Bottom row middle: ventricular APD50 and CaT50 results by stimulation rate. For the APD50 fit r2 = 0.90 and CaT50 fit r2 = 0.98. Bottom row right: superimposed voltage and calcium cycles for the ventricle.

