
Fig. 9.
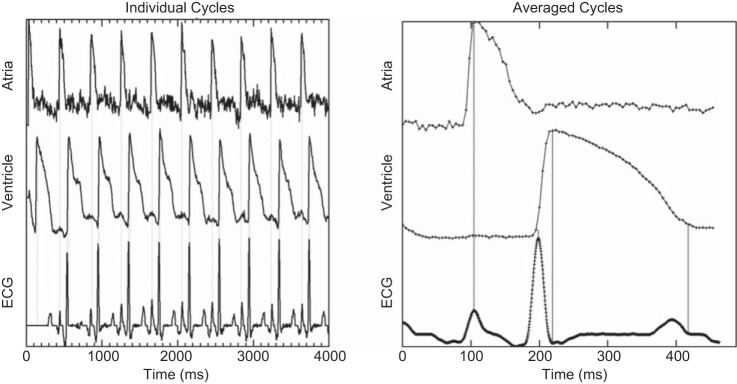
Optical mapping with simultaneous electrocardiogram (ECG) recordings. Left: optical mapping and ECG recording with baseline compensation and intensity normalization measured at 23°C. Vertical dotted lines mark atrial and ventricular action potential peaks and the R-peaks of the ECG recording. Right: average optical mapping cycles generated from the R-peak of the ECG recording. Relationships between the P-, R-, and S-peaks and the end of the T-wave are shown by dotted lines.