
Figure 1.
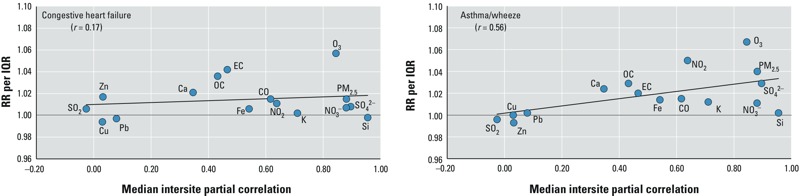
Relationships between median intersite partial pollutant correlations and rate ratios for congestive heart failure and asthma/wheeze ED visits. Trend lines indicate linear association between intersite correlations and RRs for each pollutant; r-value reflects Pearson correlation between intersite correlations and RRs; plots do not include results for alkanes, hopanes, or PAHs because these measures were only available at the Supersite/Tudor Ave. monitoring location so intersite correlations could not be computed.