
Figure 3.
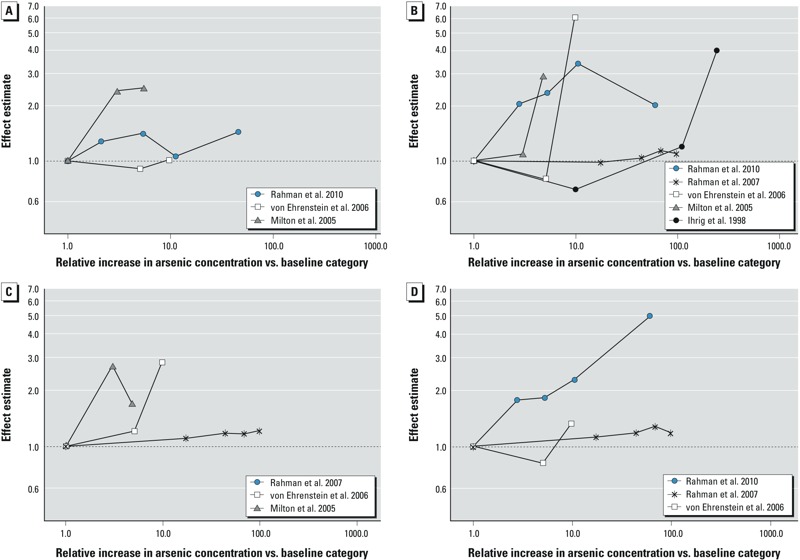
Plots of dose–response relations for arsenic and (A) spontaneous abortion, (B) stillbirth, (C) neonatal mortality, and (D) infant mortality in the general population.
Official websites use .gov
A
.gov website belongs to an official
government organization in the United States.
Secure .gov websites use HTTPS
A lock (
) or https:// means you've safely
connected to the .gov website. Share sensitive
information only on official, secure websites.
Plots of dose–response relations for arsenic and (A) spontaneous abortion, (B) stillbirth, (C) neonatal mortality, and (D) infant mortality in the general population.