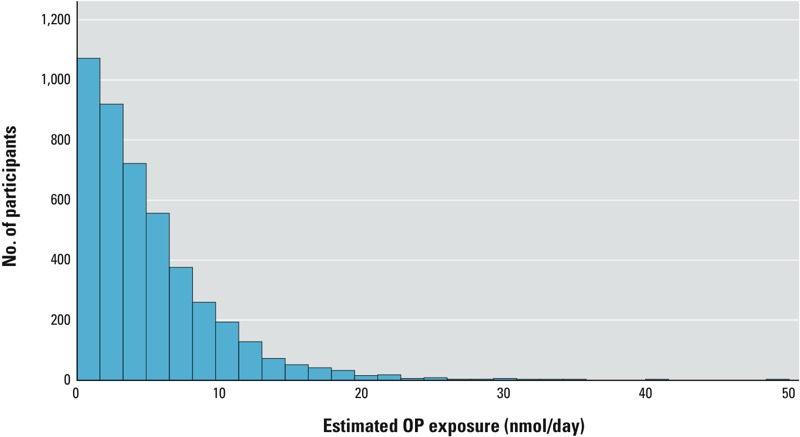
Figure 1.

Distribution of exposure estimates (nmol OPs/day) in the MESA population (n = 4,466). This distribution ranges from 0 to 49.3 nmol/day (median, 3.8; interquartile range, 1.7–6.9). For analyses occurring within the subset of participants who reported they rarely or never consume organic food (n = 2,670), the tertiles of exposure were demarcated as follows: Tertile 1, < 1.8 nmol/day; tertile 2, 1.8–4.7 nmol/day; tertile 3, > 4.7 nmol/day.
