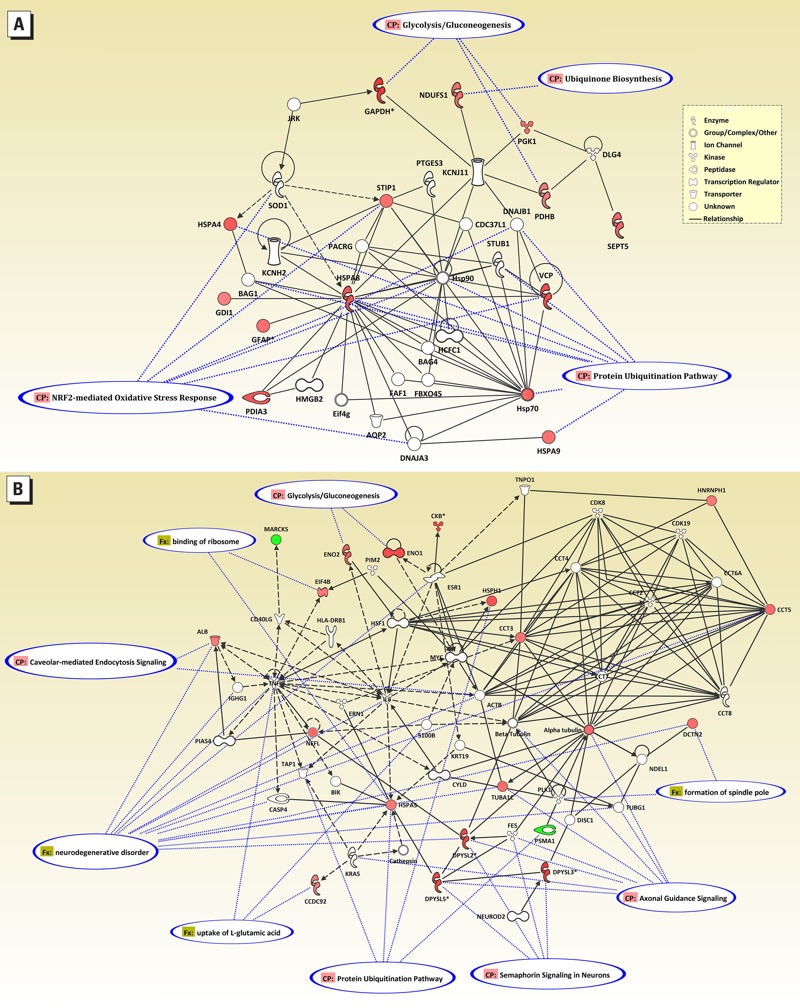
Figure 3.

Ingenuity® Pathway Analysis showing functional correlates of proteins that were affected in the hippocampus of rats developmentally exposed to DE‑71. (A) The most highly correlated network (score of 25). (B) Merged network of the next three highest ranked networks (scores of 17, 9, and 2). Symbols for differentially expressed proteins are in shades of red, with color intensity related to level of change, and symbols for networked proteins (from the Ingenuity database) are white. Associated canonical overlays are indicated by blue-outlined ovals and dotted blue lines.
