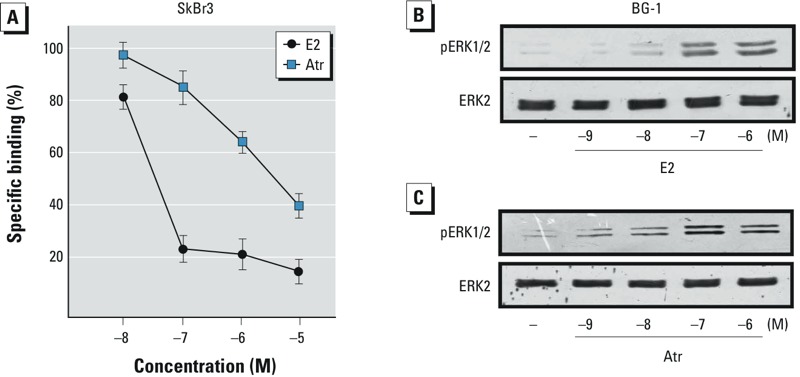
Figure 2.

(A) Ligand binding assay for GPER in SkBr3 cells exposed to increasing concentrations of E2 or atrazine (Atr) for 2 hr. Competition curves of unlabeled E2 and Atr are expressed as a percentage of maximum specific [3H]E2 binding; each data point represents the mean ± SD of three separate experiments performed in triplicate. (B,C) ERK1/2 phosphorylation in BG-1 cells exposed to increasing concentrations of E2 (B) or Atr (C) for 20 min; ERK2 served as a loading control. Data shown are representative of three independent experiments.
