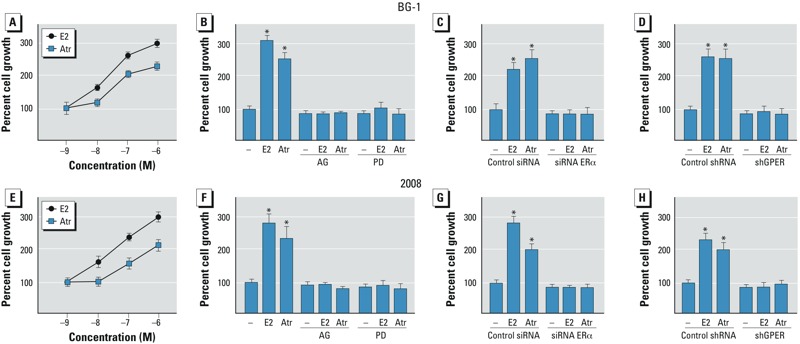
Figure 4.

Proliferation of BG-1 (A–D) and 2008 (E–H) cells treated with E2 or atrazine (Atr). Proliferation of BG-1 (A) and 2008 (E) cells in response to increasing concentrations of E2 or Atr. Proliferation of BG-1 (B–D) and 2008 (F–H) cells treated with vehicle (–), 100 nmol/L E2, or 1 μmol/L Atr alone or in combination with 10 μmol/L AG or 10 μmol/L PD (B,F), or transfected with control siRNA or siRNA ERα (C,G) or control shRNA or shGPER (D,H). Proliferation of vehicle-treated cells was set at 100%; Values shown are mean ± SD of three independent experiments performed in triplicate. *p < 0.05 compared with vehicle-treated cells.
