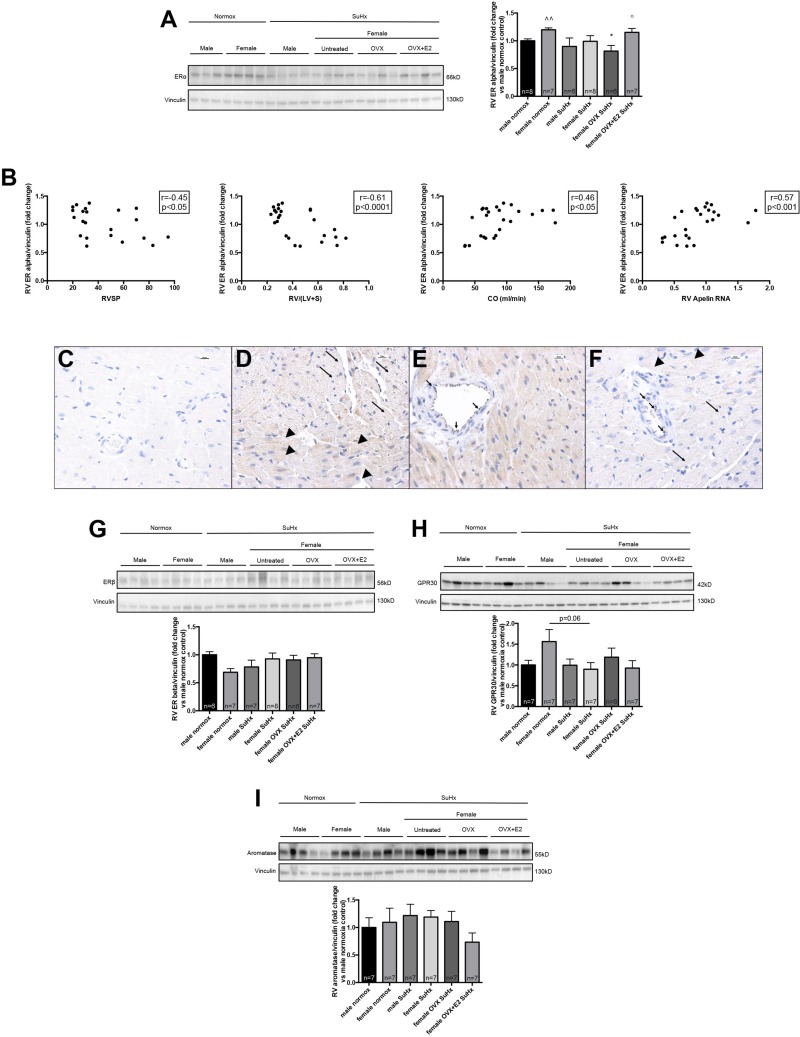
Fig. 6.
E2 repletion in OVX rats attenuates SuHx/OVX-induced decreases in RV ERα expression, and RV ERα expression correlates negatively with RV hypertrophy and RVSP, and positively with CO and proangiogenic and procontractile signaling. A: effects of sex, OVX, and E2 repletion in OVX rats on ERα in RV homogenates from SuHx-PH rats. SuHx exposure, OVX, and E2 repletion were as outlined in Fig. 1. Male and female rats exposed to neither Su5416 nor hypoxia served as controls. RV samples were derived from RV outflow tract. ERα expression was determined by Western blotting and densitometric analysis (normalized for vinculin control and expressed as fold change vs. male normoxia control). Representative Western blot is shown at left, with densitometry results from all samples depicted in the bar graph at right. Note that OVX in female SuHx-PH rats was associated with a decrease in RV ERα expression, which was attenuated by E2 repletion. Groups are as outlined in legend for Fig. 2. Values are means ± SE. *P < 0.05 vs. female normoxia control; °P < 0.05 vs. female OVX SuHx; ^^P < 0.01 vs. male normoxia control (1-way ANOVA with post hoc Dunnett's test). B: correlations between RV ERα expression (determined by Western blotting and densitometry normalized for vinculin; see A) and RV hypertrophy (determined by Fulton index; see Fig. 2A), RVSP (see Fig. 2B), CO (determined by echocardiography), and RV apelin RNA expression (by real-time RT-PCR; see Fig. 4E) in female rats. Data points represent individual animals. Rats from the 4 female treatment groups were included in the analyses. Pearson correlation coefficients and levels of significance are indicated in the boxes at top right of each panel. C–F: representative images of ERα expression in RV sections derived from apex of free wall of normal females (D and E) and SuHx females replete with E2 (F), the groups with the strongest RV ERα expression. Negative control is depicted in C. Note predominant ERα expression in cytoplasm of RV cardiomyocytes, which occurred in a striated pattern in longitudinal sections (long arrows in D) and in a punctate pattern in transverse sections (arrowheads in D). Note that no ERα expression was observed in smooth muscle layer of coronary vessels (E), whereas coronary endothelial cells stained positive for ERα (short arrows in E). Findings noted in normal females were recapitulated in SuHx OVX+E2 rats (F). All images are ×40, size bar = 10 μm. G–I: effects of sex, OVX, and E2 repletion in OVX rats on RV ERβ (G), GPR30 (H), and aromatase (I) expression. Representative Western blots are shown at top, with densitometry results (normalized for vinculin control and expressed as fold change vs. male normoxia control) from all samples depicted in bar graphs. No significant differences were noted by 1-way ANOVA with post hoc Tukey's or Dunnett's test.

