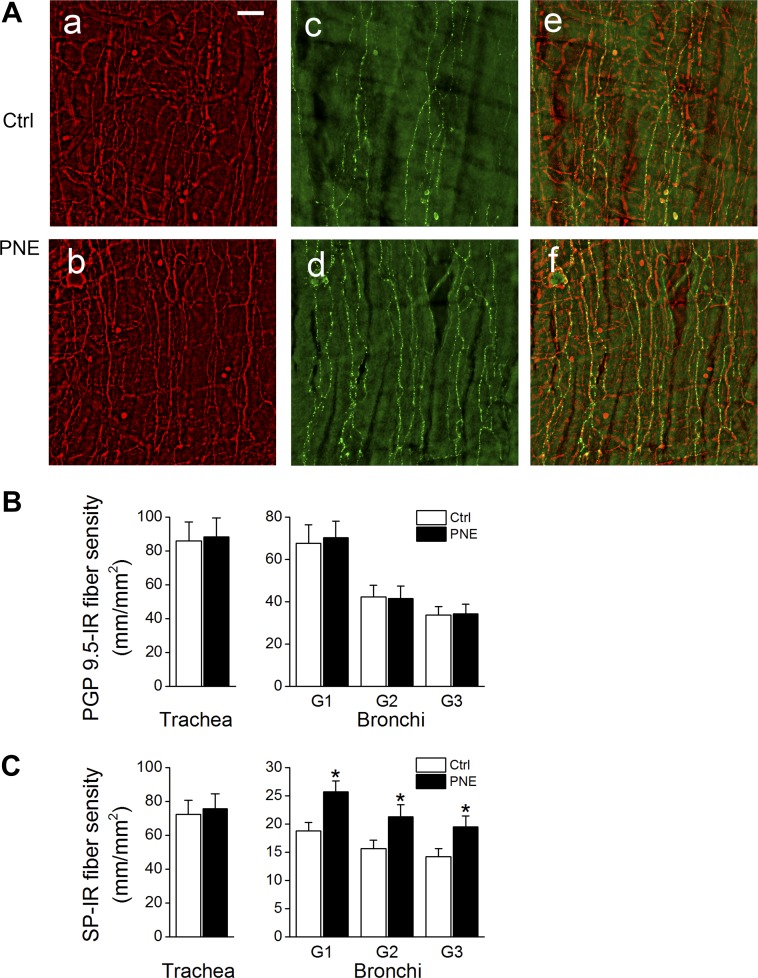
Fig. 6.
PNE induced changes in the density of airway substance P-immunoreactive (SP-IR) fibers. A: typical micrographs showing protein gene product (PGP)9.5-IR (red), SP-IR (green) fibers, and their merged images in the epithelial and submucosal layers of first generation of bronchial wall in a Ctrl (top, a, c, e) and a PNE pup (bottom, b, d, f). The bar = 50 μm. B and C: group data of the PGP9.5-IR and SP-IR fiber densities of the trachea and bronchi (1st, 2nd, and 3rd generations, G1, G2, and G3), respectively; n = 5 for each group; means ± SE; *P < 0.05 between Ctrl and PNE pups.

