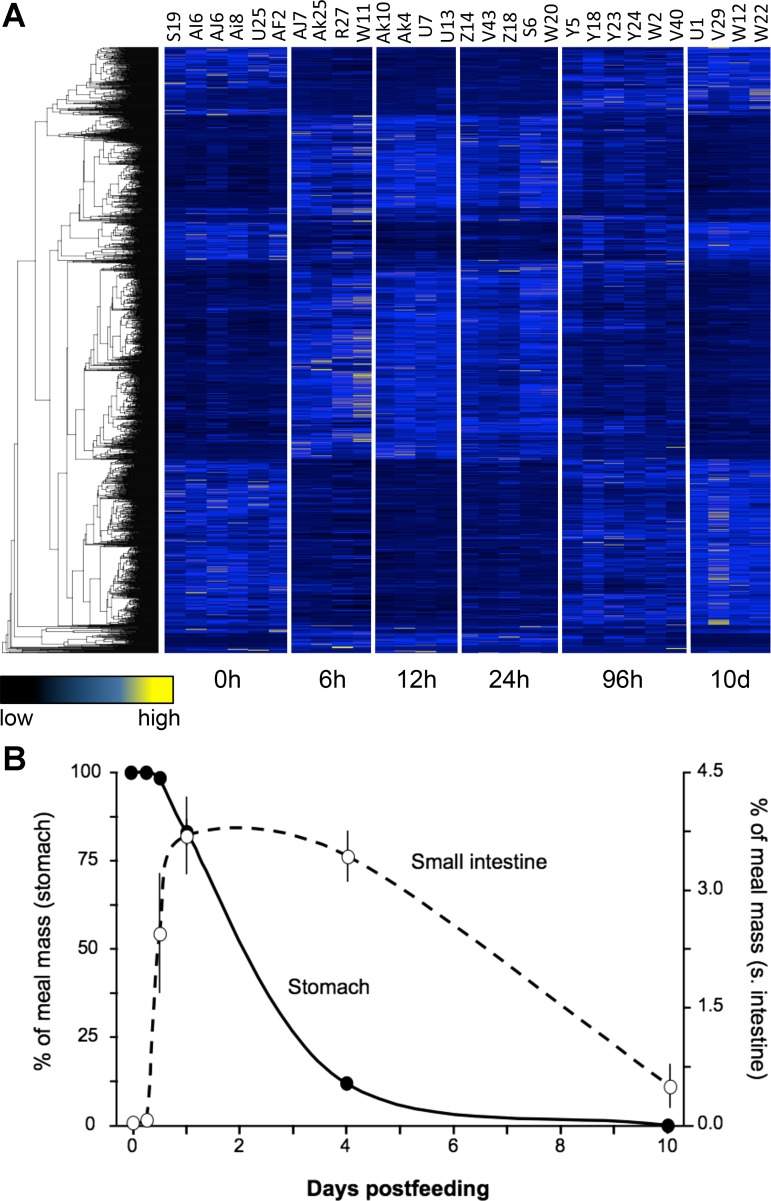
Fig. 3.
General trends of gene expression and digestion across postfed time-points. A: heat-map of gene expression for 1,772 genes found to be significantly differentially expressed across time-points based on regression analysis. Each column represents a replicate, with time-points clearly delimited, and each row represents a gene, which are clustered by similarity using average linkage hierarchical clustering. B: percent of meal mass in stomach (filled circles and solid line) and small intestine (open circles and dashed line) across postfeeding time-points.

