Figure 5. Fam20A and Fam20C form a complex that is catalytically more active.
(A) Gel filtration analysis of Fam20A/Fam20C complex. Purified Fam20A and Fam20C were pre-incubated on ice and passed through Superdex 200. Proteins from different fractions were separated by SDS-PAGE and visualized by Coomassie staining. Fam20A or Fam20C alone were analyzed as controls. The calibration standard is shown on top. (B) Gel filtration analysis of Fam20B and Fam20C. (C) Co-immunoprecipitation of Fam20A and Fam20C from cells. Fam20C-Flag, Fam20A-V5, or Fam20B-V5 was stably expressed in U2OS cells as indicated. (D) Co-immunoprecipitation of Fam20A-Flag and Fam20A-V5 from U2OS cells. (E) Analytical ultracentrifugation sedimentation velocity analysis of Fam20A/Fam20C complex. The plot represents the molecular mass distribution c(M) vs the apparent molecular mass (Da). The main peak has a calculated weight of 245 kDa. (F) Fam20C kinase reaction initial velocities vs concentration of ENAM (173–277) S191A. Fam20C (2 μg/ml) and Fam20A (40 μg/ml) were used in this experiment. Data points are represented as mean ± SD and fitted by non-linear regression of the Michaelis-Menten equation. (G) Immunoprecipitation of Fam20A-Flag or Fam20C-Flag from either cell lysate (C) or the conditioned medium (M). U2OS cells stably expressing Fam20A-Flag, Fam20C-Flag or both Fam20C-Flag and Fam20A-V5 were used.

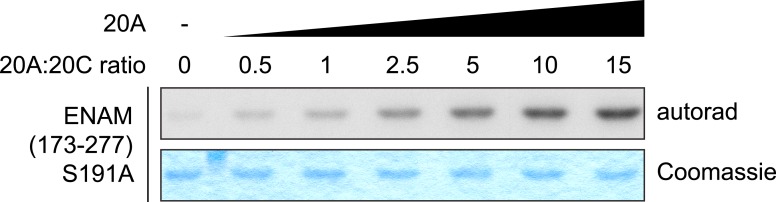
Figure 5—figure supplement 1. Saturation of Fam20C kinase activity by Fam20A in vitro.