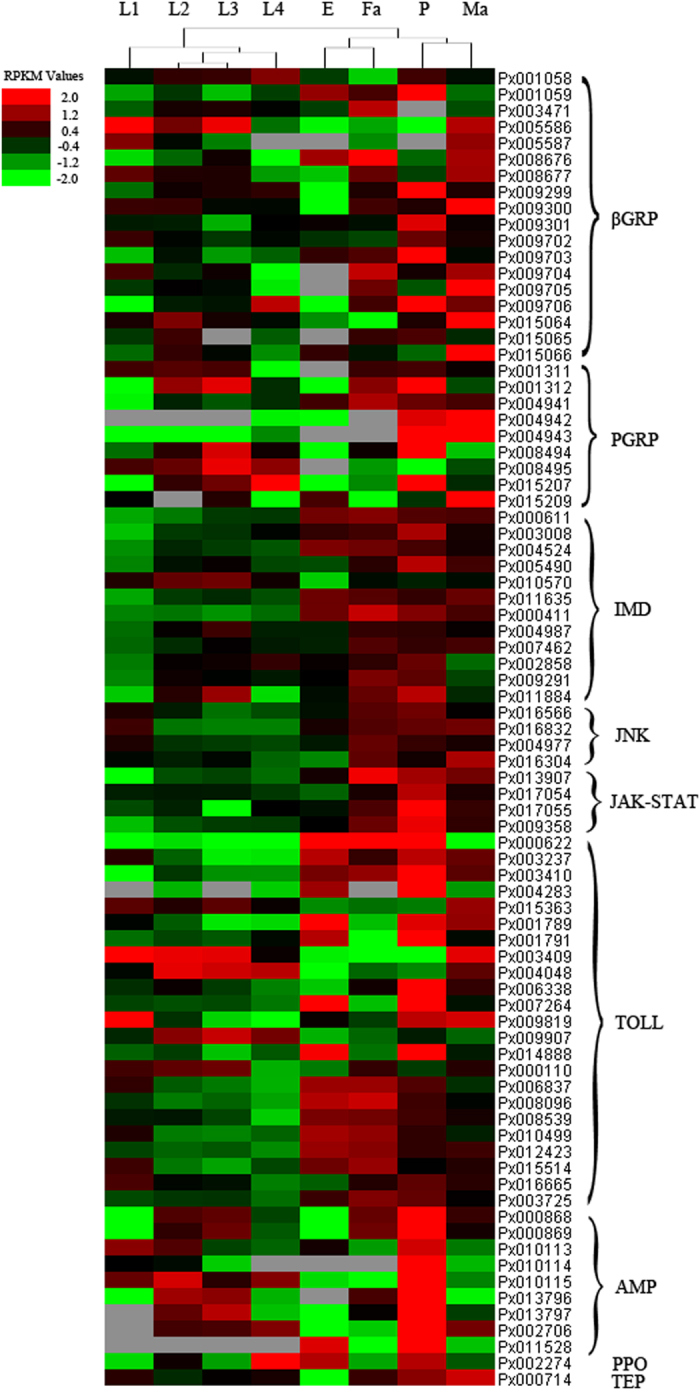
Figure 3. Expression profiling of immune genes at different developmental stages of P. xylostella.

E: Egg; L1: 1st instar larva; L2: 2nd instar larva; L3: 3rd instar larva; L4: 4th instar larva; P: Pupa; Ma: Male adult; Fa: Female adult. Red represents the up-regulated genes, green indicates the down-regulated genes, and black represents no change in gene expression.
