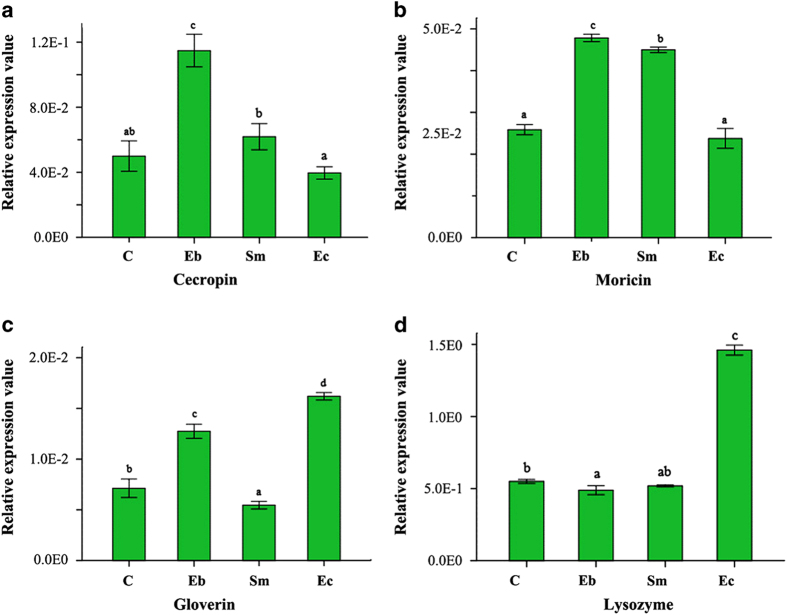
Figure 4.
Differential expressions of AMPs induced by bacterial infection. C: Control, Eb: Enterobacter sp., Sm: Serratia sp., Ec: Enterococcus sp. Different letters over the columns within a graph denote significant differences (p < 0.05) among the different bacterial treatments, as determined by one-way ANOVA followed by LSD post hoc test.

