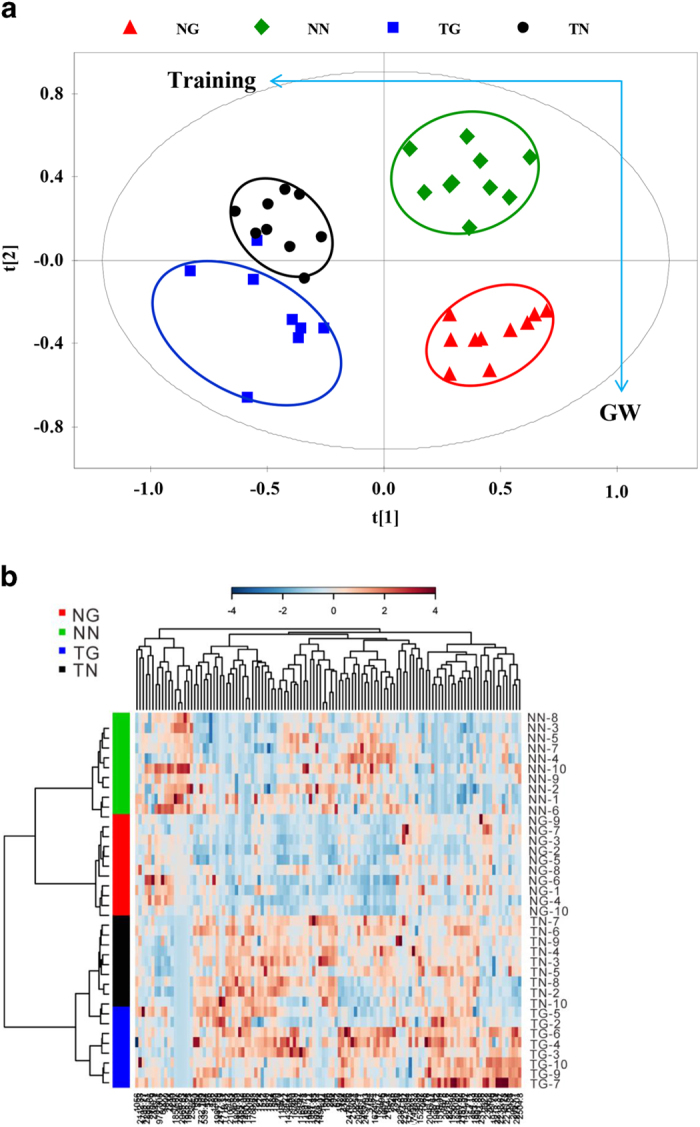
Figure 2. Metabolomic analysis of serum fatty acids.

(a) shows PCA scores trajectory plots, (b) shows the representative heat map of untrained (NN and NG) and trained (TN and TG) mice. In the heat map, samples are sorted by row and metabolites are sorted by column. Green diamond, NN; Red triangle, NG; Black circle, TN; Blue square, TG;
