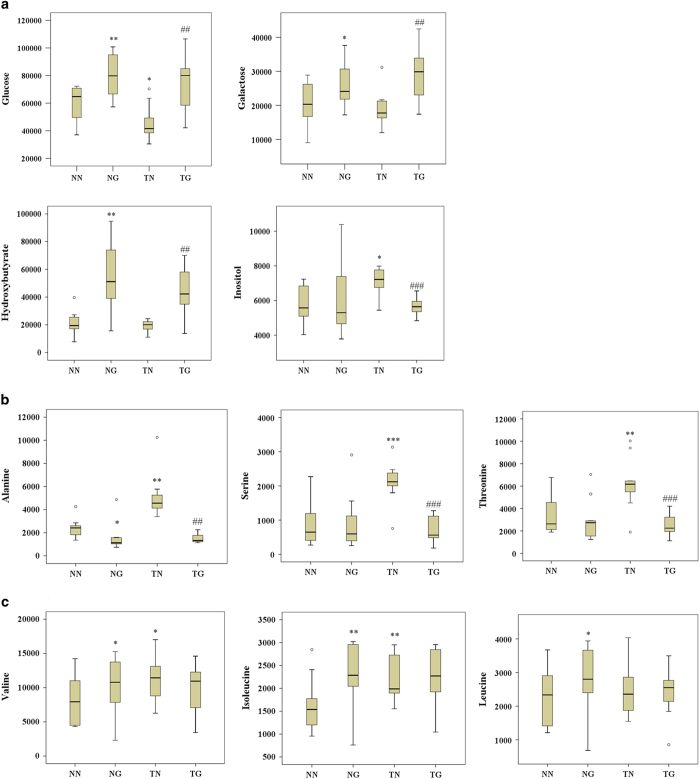
Figure 6. Metabolites that were significantly different between groups.
(a) shows serum glucose, galactose, hydroxybutyrate, and inositol. (b) shows serum glucogenic amino acid levels and (c) shows levels of branched chain amino acids (n = 10–11 per group). *p < 0.05, **p < 0.01 compared to the NN group; #p < 0.05 compared to the TN group.

