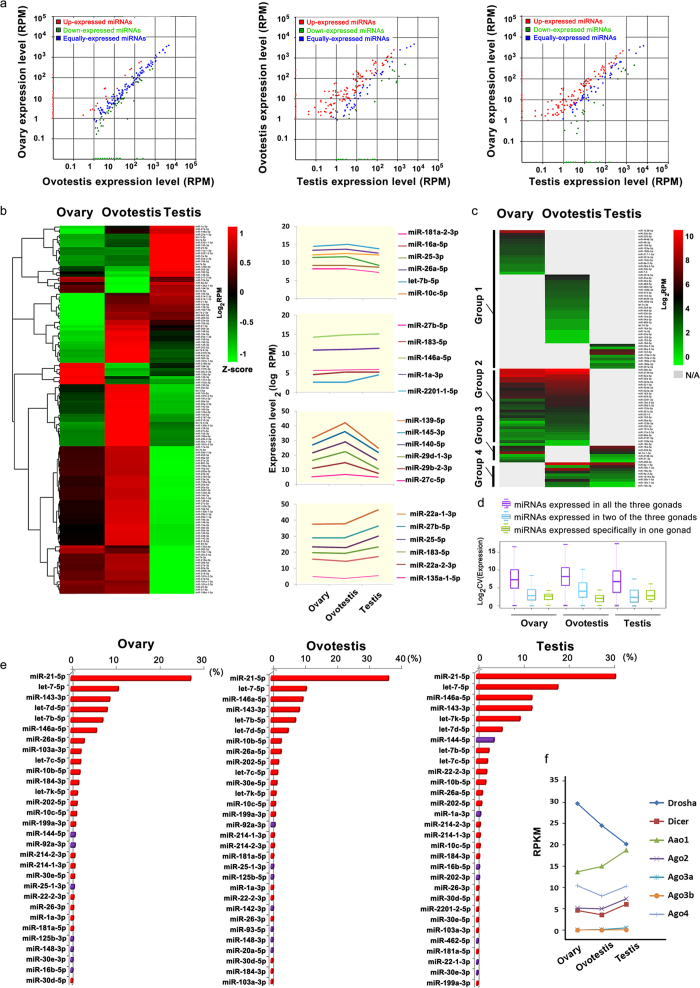
Figure 4.
Expression profiling of conserved miRNAs during gonad reversal. (a) Scatter plot charts indicate the differential expressions of miRNAs in three types of gonads respectively. Red and green dots represent miRNAs up-regulated and down-regulated with a fold change >2 respectively, while the blue dots represent equally expressed miRNAs between two types of gonads. RPM, reads per million reads. (b) Hierarchical clustering of the conserved miRNAs and their expressions among ovary, ovotestis and testis. Colors indicate relative expressions compared to the mean value. For each miRNA, red and green colors indicate high and low frequency, respectively. A substantial fraction (66.42%) of the conserved miRNAs are highly expressed in ovotestis. 28 miRNAs (20.44%) are highly expressed in testis, and 14 miRNAs (10.22%) are enriched in ovary. The examples of the enriched miRNAs at different stages of gonads during sex reversal are indicated on the right column. (c) The heatmap shows that a fraction of the conserved miRNAs is specifically expressed in one or two types of gonads. (d) Comparisons of miRNA expression levels among different gonads show that the miRNAs expressed in three types of gonads exhibit higher levels than in one or two types of gonads. (e) Top thirty of the conserved miRNAs with the highest abundance in gonads. The most of these miRNAs (23, red) are enriched in all three gonads. The y axis, miRNA names; the x axis, % reads in each gonad. (f) Differential expression of the miRNA pathway genes (Drosha, Dicer and Ago members: Ago1, 2, 3a, 3b and 4) in the ovary, ovotestis and testis.

