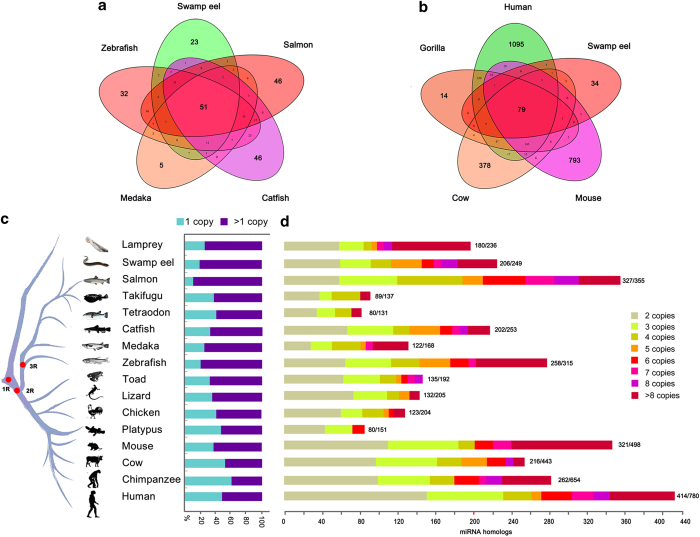
Figure 6.
Evolutionary conservation and duplications of miRNAs in vertebrates. (a) Venn charts show that miRNAs are conserved among swamp eel, other teleosts (a) and mammals (b). Most of miRNAs among the teleosts and mammals are well-conserved (85.3%, swamp eel vs mammals), while the others are poorly-conserved. Data were from miRBase v21.0 and this study. (c) Relative percentages between single and multiple-copy miRNA precursors. Conserved miRNAs detected at least in two species were used in this analysis. The miR-430 has 78 copies, which result in a high proportion of multiple copies in lamprey. The bars show percentages of single or multiple-copy miRNA precursors. Red dots on the evolution tree indicate 1, 2, and 3 times of whole genome duplications during vertebrate speciation. (d) Numbers of multiple-copy miRNA precursors (n >1) in each species. miRNA homologs with a certain copy number include miR-n-1 , …-n-n; miR-na, -nb, …-nz; n = 1, 2, ..n. The numbers at the end of bars indicates multiple-copy numbers/total conserved miRNAs.

