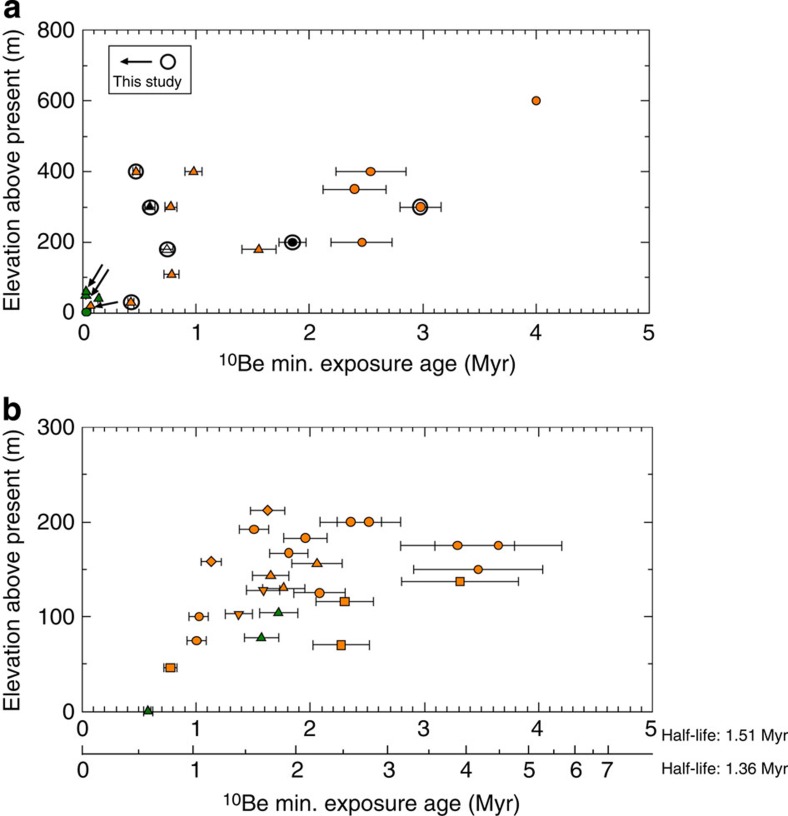
Figure 2. Area 1 ice sheet history.
(a) Exposure ages from the Sør Rondane Mountains from this study (denoted in Fig. 1) and previous studies25,26. Circles and triangles indicate samples north (downstream) and south (upstream) of 72 °S, respectively. The black symbol indicates samples lacking 26Al measurement, and filled and open symbols refer to bedrock and erratic samples, respectively. (b) Compiled Grove Mountains exposure ages27,28,29,30. In both panels, 1σ uncertainty is shown, and orange and green symbols indicate simple and complex exposure history, respectively.

