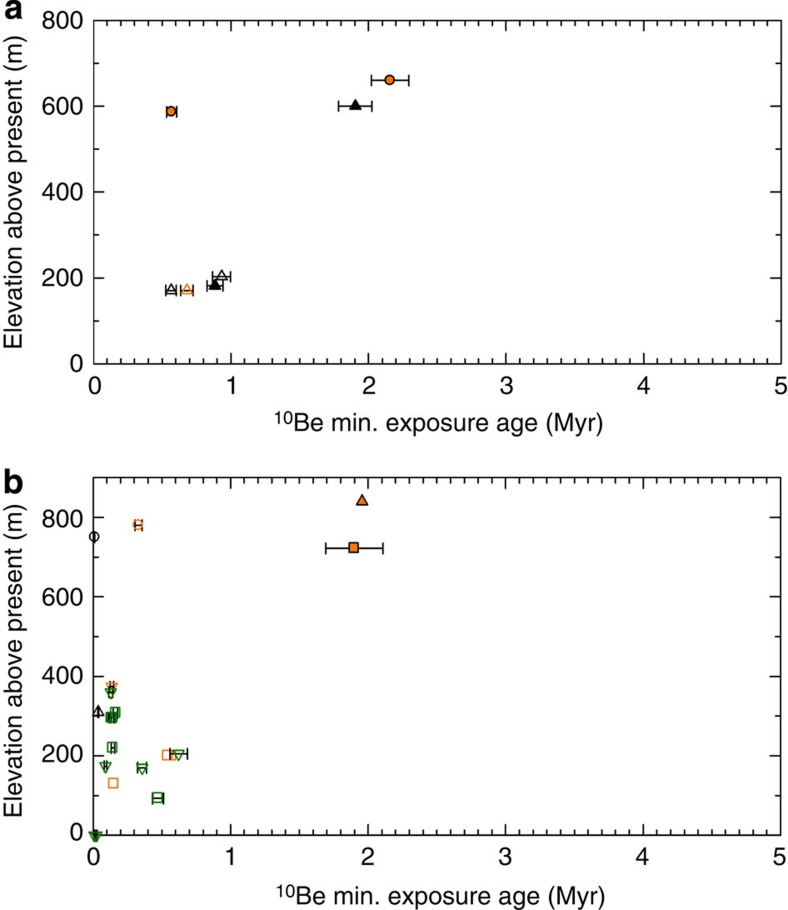
Figure 4. Area 3 ice sheet history.
Compiled exposure ages from (a) the Fisher Massif (triangles) and Amery Oasis (circles) in the Prince Charles Mountains37, and (b) the Black Ridge (circles), Mt. Keinath (triangles), Mt. Abbott (squares) and Mt. Browning (inverted triangles) in the Deep Freeze Range38,39. Systematic uncertainties of ±1σ are also indicated. Orange and green symbols indicate simple and complex exposure history, respectively, and black symbols indicate samples with only 10Be measurement. Filled and open symbols refer to bedrock and erratic samples, respectively.

