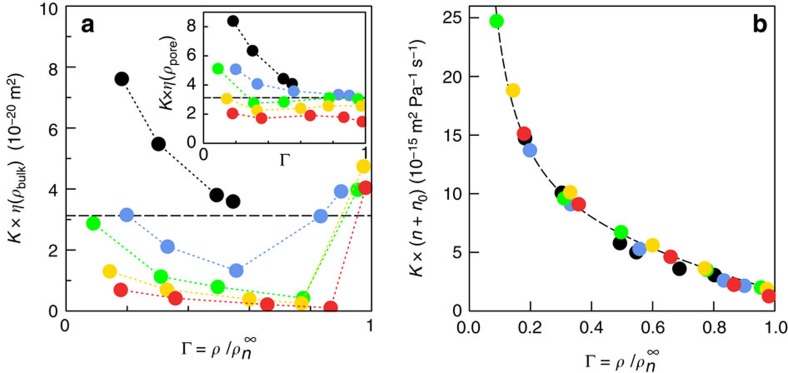
Figure 3. Breakdown of Darcy law and permeance master curve for alkane transport.
(a) Permeability η × K versus loading Γ  , showing the breakdown of the hydrodynamic prediction for the permeance: methane (black), propane (blue), hexane (green), nonane (yellow) and dodecane (red). The viscosity is that of the bulk hydrocarbon at the corresponding pressure and temperature. Inset: Same plot with the bulk viscosity replaced by the bulk viscosity calculated at the relevant pore density, ρpores. For comparison, the dashed lines give the permeability of a cylindrical pore with diameter equal to the mean size of the matrix pore-size distribution. (b) Permeance master curve: K × (n+n0) (with n0=2) versus loading (same symbols as in a). This demonstrates that K∼1/n with n the alkane length. The dashed line is a guide to the eye.

