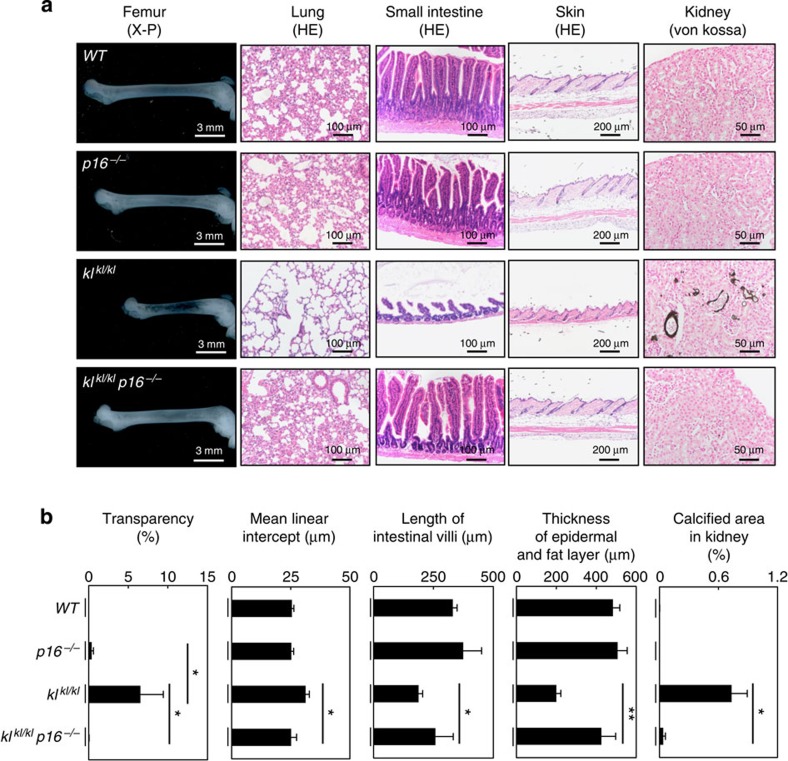
Figure 2. Reversing the ageing phenotypes of klkl/kl mice by p16INK4a ablation.
(a) Histological analysis of 11-week-old female WT, p16−/−, klkl/kl and p16−/− klkl/kl mice. Representative images of bone radiographs of femurs (X-P), HE of tissues indicated top and von Kossa staining (von Kossa) of the kidney for detecting ectopic calcification were shown. (b) The histograms indicate the quantitative analysis of X-ray transparency of femur (WT (n=3), p16−/− (n=3), klkl/kl (n=6) and p16−/− klkl/kl (n=3)), the mean linear intercept (Lm) in lung tissue (WT (n=9), p16−/− (n=9), klkl/kl (n=7) and p16−/− klkl/kl (n=9)), intestinal villi length (WT (n=14), p16−/− (n=7), klkl/kl (n=11) and p16−/− klkl/kl (n=3)), epidermal and subcutaneous fat layer thickness (WT (n=6), p16−/− (n=6), klkl/kl (n=8) and p16−/− klkl/kl (n=3)) and the percentages of calcified areas in kidneys (WT (n=3), p16−/− (n=3), klkl/kl (n=3) and p16−/− klkl/kl (n=3)). For graphs of X-ray transparency of femur and Lm in lung tissues, data were analysed by Mann–Whitney U-test and are displayed as mean±s.e.m. For graphs of intestinal villi length, epidermal and subcutaneous fat layer thickness and the percentages of calcified areas in kidneys, data were analysed by Student's t-test and are displayed as mean±s.e.m. For all graphs: *P<0.05, **P<0.01.

