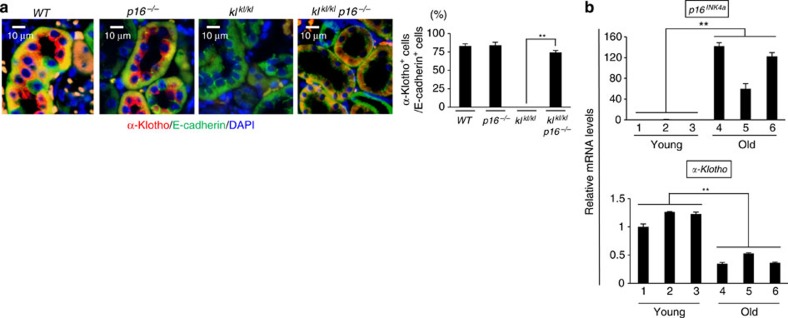
Figure 5. Inverse correlation between α-klotho and p16INK4a expression.
(a) Immunohistochemical analysis of α-klotho (red), E-cadherin (green) and 4,6-diamidino-2-phenylindole (blue) in 11-week-old male mouse kidney sections of each genotype. Representative results of three individual male mice were shown. The histograms indicate the percentages of E-cadherin-expressing cells that were positive for α-klotho expression. At least 100 cells were scored per group. (b) The relative levels of indicated mRNA in kidneys of young (10- to 20-week-old) or old (120- to 140-week-old) Wt male mice were examined using RT–qPCR. Representative results of three individual male mice were shown. For all graphs, the experiments were performed in triplicate, and representative results from three independent experiments are shown. Data were analysed by Welch's t-test and are displayed as mean±s.d. *P<0.05, **P<0.01.

