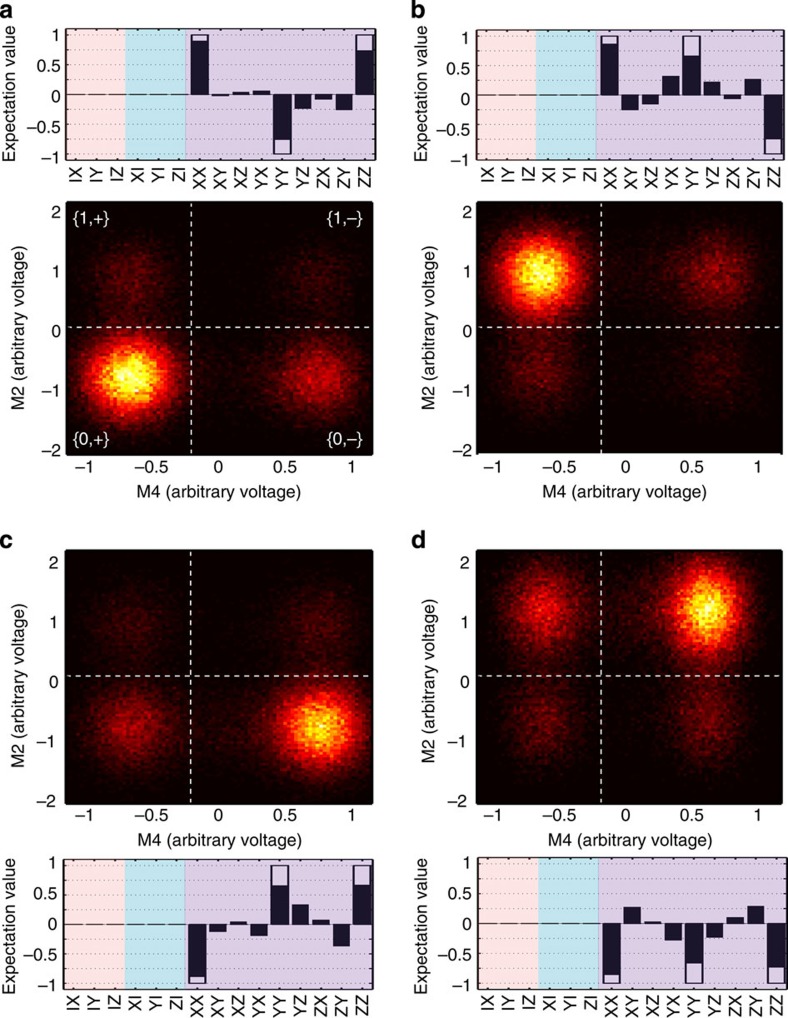
Figure 2. Correlated syndrome single-shot histograms and quantum state tomography of code qubits.
The quantum state of the syndrome qubits reveals the entangled state of the code qubits. The colormaps show the single-shot histograms of the syndrome measurements on Q2 and Q4. The dashed white lines indicate the threshold used to condition the reconstruction of the code qubit states, represented by a Pauli vector. The pink-, blue- and purple-shaded regions signify Q1, Q3 and joint Pauli operators, respectively (black filled bars, experiment, white bars in background, ideal). Each of the possible four outcomes of correlated single-shot measurements of the syndrome qubits is mapped onto one of the four maximally entangled Bell states of the code qubits. Since we always prepare the code qubits in the codeword state  at the beginning of the quantum process, when no error is applied to Q1, state tomography of Q1 and Q3 conditioned on outcomes in the lower left quadrant {0,+} of the colormap recover the same state with fidelity 0.8491±0.0005 (a). Introducing an error ɛ equal to X (b), Z (c) and Y (d) on Q1, and conditioning on outcomes in the upper left {1,+}, lower right {0,−} and upper right {1,−} quadrants results in the code qubits reconstructed as
  (fidelity 0.8195±0.0006),
  (with fidelity 0.8046±0.0005) and
  (fidelity 0.8148±0.0006), respectively. The X-syndrome qubit, Q4, is found in its excited state when a phase-flip error has occurred (c,d), whereas the Z-syndrome qubit, Q2, is found in its excited state as a result of bit-flip errors (b,d). The quoted uncertainties in reconstructed state fidelities are statistical (see Methods), but we note that systematic errors due to coherence time fluctuations, state preparation and measurement errors can lead to indifelity ∼0.01–0.02.

