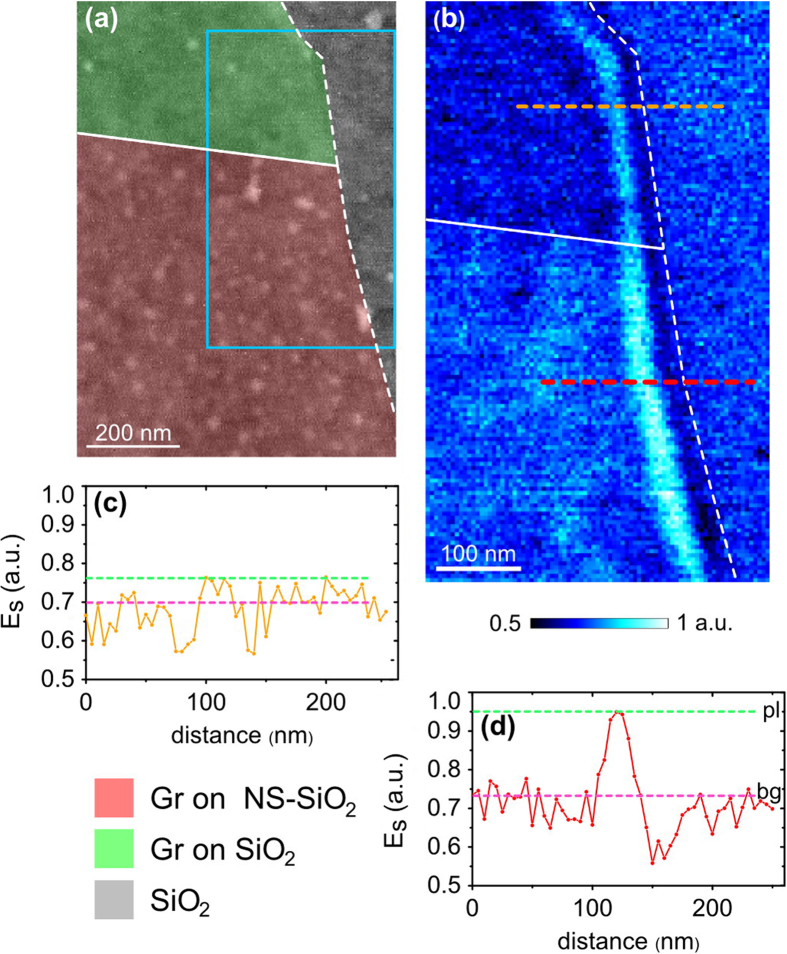
Figure 4. Demonstration of GPs damping suppression in graphene, exfoliated directly at the boundary between SiO2 and NS-SiO2.
(a) AFM topography; the pink and green colours highlight graphene on NS-SiO2 and graphene on approximately clean SiO2, respectively. (b) Near-field optical image (recorded at λ1 = 10 μm) of the graphene flake, corresponding to the region marked with a cyan frame in image (a) solid white line highlights the boundary between graphene on NS-SiO2 and graphene on SiO2; dotted white line marks the edge of the flake. (c,d) Corresponding cross-sections along orange and red dotted lines in image (b); green and pink dotted lines in images (c,d) mark GP field magnitudes at the first maximum close to the graphene edge, and inside the inner part of the flake.

