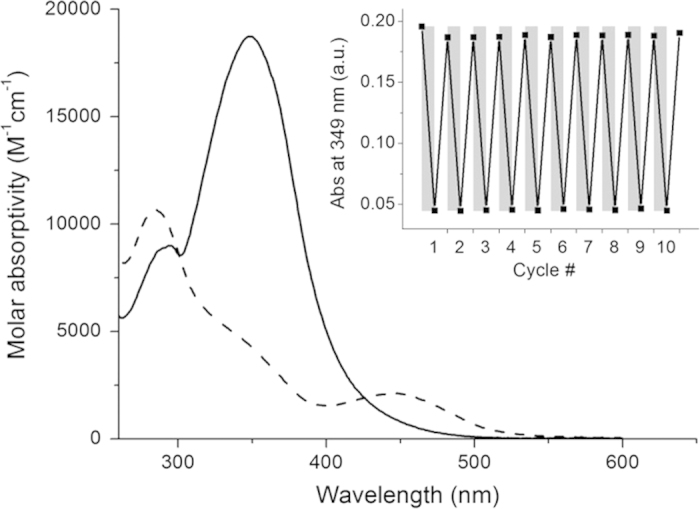
Figure 4.

UV/Vis absorption spectra and photoswitching of 4. The as-dissolved E-4 (solid line) was subjected to 3 min 365 nm light, yielding a photostationary distribution (PSD) of 87/13 [Z-4]/[E-4] (dashed line). Inset: Photoswitching of 4 (10 μM) monitored at λ = 349 nm, starting with pure E-4 followed by alternating irradiation periods of 3 min 365 nm (gray bars) and 3 min 503 nm (white bars).
