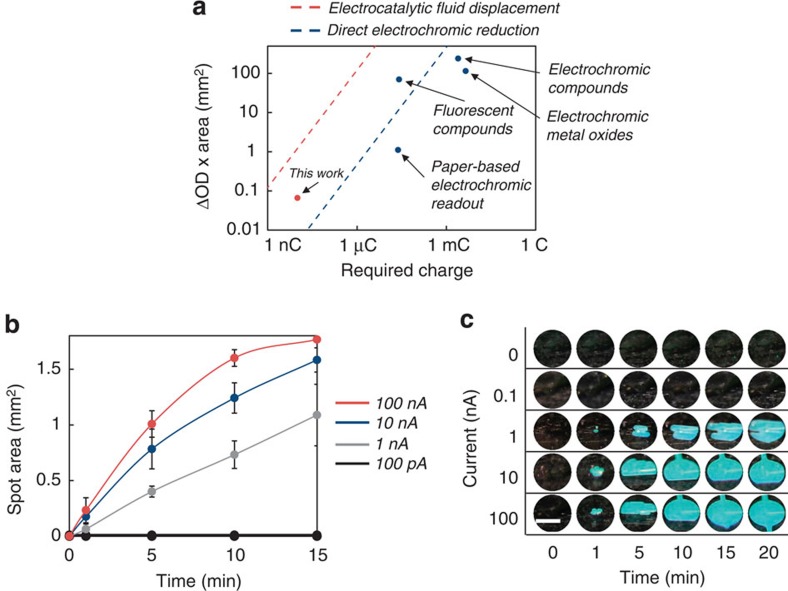
Figure 5. Electrocatalytic fluid displacement reveals a structural colour change.
(a) Comparison of the charge required to induce a visible colour of a certain area and optical density change for a variety of read-out strategies. The dashed red line represents the calculated exposed area of a bubble generated using electrocatalytic fluid displacement. We assume the bubble is confined to a 50-μm tall chamber, the reaction proceeds for 10 min, and the ΔOD is 1. The dashed blue line represents the area of a monoatomic layer of platinum directly reducible by the current. We assume the ΔOD is 1 and thus this represents an upper bound using this strategy. (b) Spot size as a function of time for various deposition currents using electrodes with the highest mesh density. Bubbles do not form when no current is applied. Error bars represent s.e. (n=3). (c) Images of colorimetric read-out as a function of deposition current and time using a diffraction grating. The window turns from optically transparent (which appears as black due to a black background) to cyan as light at that wavelength is diffracted towards the camera. One-nA currents are detectable in 1 min. Scale bar, 1 mm.

