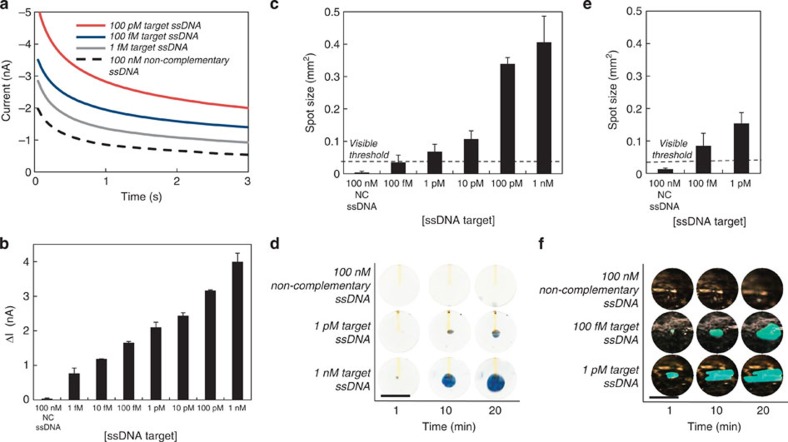
Figure 6. Colorimetric detection of DNA.
(a) Electrochemical current as a function of time for various analyte concentrations after applying 250 mV w.r.t. to a Ag/AgCl reference electrode for 3 s. (b) Average peak electrochemical current as a function of analyte concentration. Negative control is non-complementary (NC) DNA. (c) Spot size as a function of target DNA concentration after 10 min using dye displacement. One-pM ssDNA is detectable by eye. The visible threshold is defined as an area of 200 mm × 200 mm. (d) Images of the EFD device showing growth of the bubble over time as a function of ssDNA concentration using dye displacement. (e) Spot size as a function of target DNA concentration after 10 min using a structural colour change. (f) Images of the EFD device showing growth of the bubble over time as a function of ssDNA concentration using a structural colour change. Scale bar, 1 mm. Error bars represent s.e.; all measurements represent n>5 trials.

