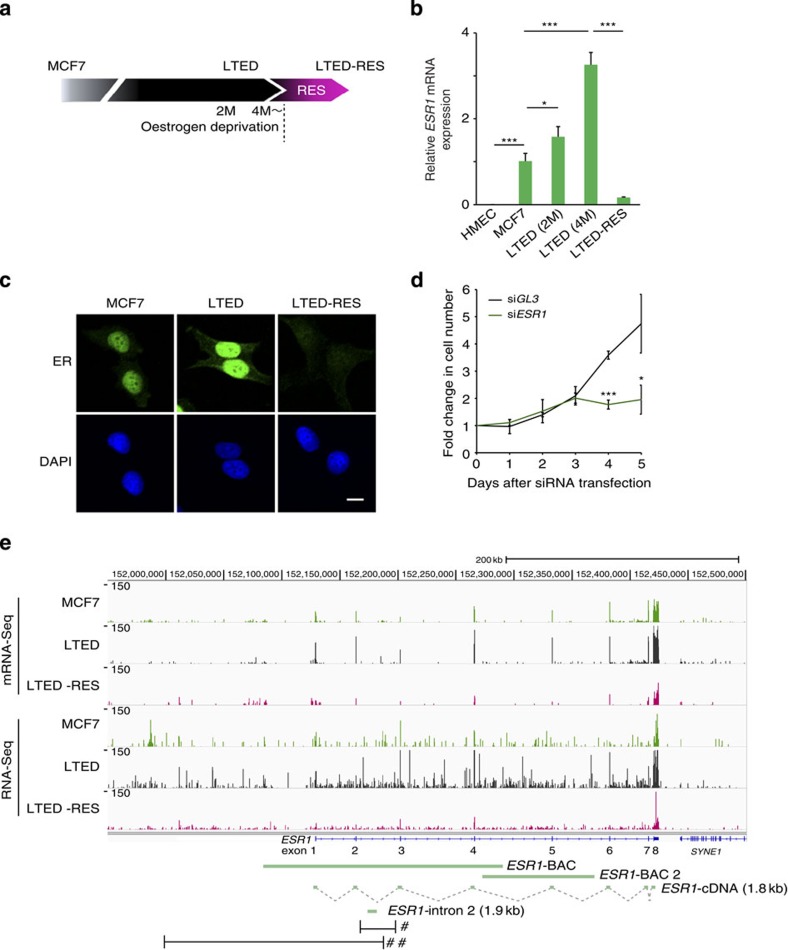
Figure 1. Eleanors and ESR1 mRNA are coordinately expressed in LTED and LTED-RES cells.
(a) Schematic representation of the cell models used in this study. ER-positive MCF7 breast cancer cells were cultured under three conditions: MCF7, LTED and LTED-RES. (b) Expression levels of ESR1 mRNA. qRT–PCR results under the MCF7 condition were set to 1. Primers were designed to cover the exon–exon junction. Values are the means±s.d.; n=3. P-values were calculated using Student's t-test (*P<0.05, ***P<0.001). (c) Immunofluorescence of ER showing enhanced expression in LTED cells and its suppression by resveratrol treatment (LTED-RES). Scale bar, 10 μm. (d) ESR1 knockdown inhibits LTED cell proliferation. LTED cells were treated with siRNA targeting ESR1 for the indicated periods. Cell growth is shown as fold changes. Values are the means±s.d.; n=3. P-values were calculated using Student's t-test (*P<0.05, ***P<0.001). (e) Gene tracks representing mRNA-Seq and RNA-Seq data of the human ESR1 locus. Novel ncRNAs, termed Eleanors, were abundantly expressed in LTED cells from the entire ESR1 locus, which were detected as read signals in non-exonic regions. Eleanors were suppressed in LTED-RES cells. The structures of ESR1 and downstream SYNE1 genes are shown below. Green bars indicate the FISH probes used in this study. Regions highlighted in Figs 2a and 4a are denoted by # and ##, respectively. 2M, two months; 4M, four months.

