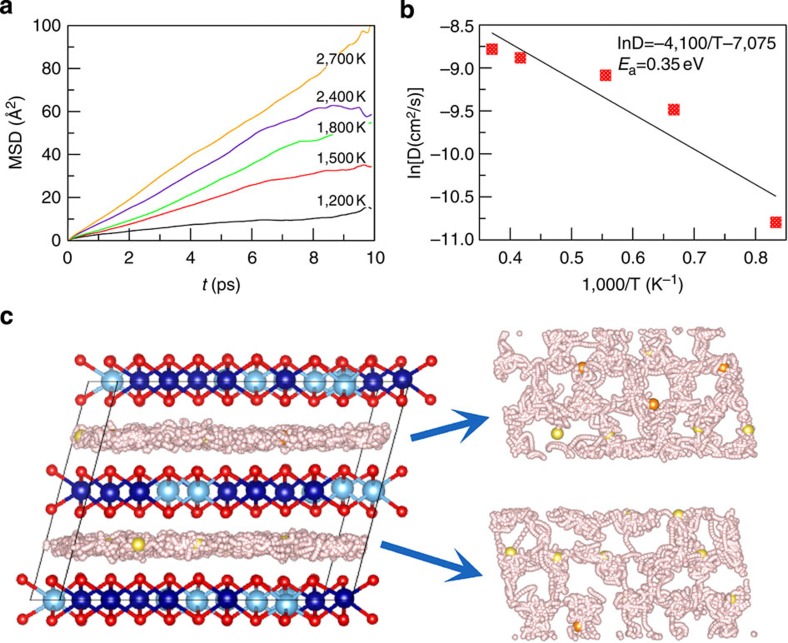
Figure 8. Na+ ion transport properties of P2-Na0.6[Cr0.6Ti0.4]O2 obtained by FPMD simulations.
(a) MSD at 1,200, 1,500, 1,800, 2,400 and 2,700 K. (b) Arrhenius plot of diffusion coefficients, from which the Na+ ion migration energy barrier of 0.35 eV is obtained. (c) Trajectories (small grey bullets) of Na+ ion in FPMD simulations at 1,800 K from 5 to 8 ps in P2-Na0.6[Cr0.6Ti0.4]O2, the top view of each Na+ layer is given in the right panel. The initial positions of Na1 (yellow), Na2 (orange), Cr (blue), Ti (light blue) and O (red) are shown for clarity.

