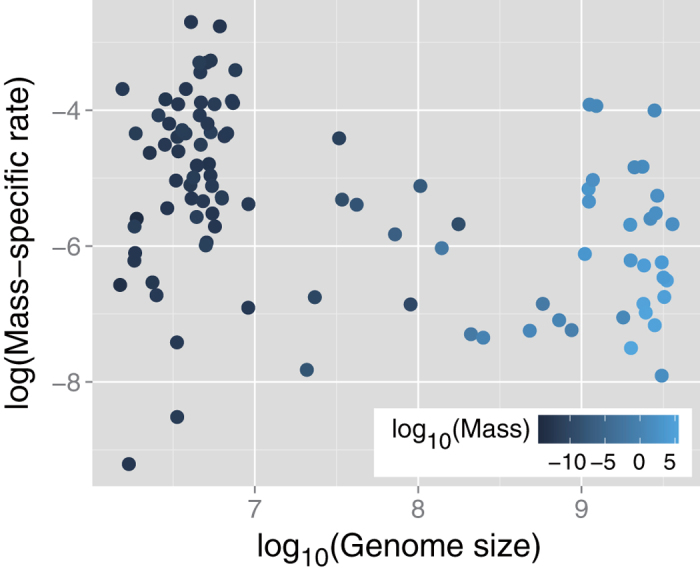
Figure 1. Scatter plot of mass-specific metabolic rate versus genome size.

Vertical and horizontal axes are on logarithmic and base-10 logarithmic scales, respectively. Symbol color indicates base-10 logarithmic body mass. The mass-specific rate negatively correlates with genome size (Spearman’s rank correlation coefficient rs = –0.31, and p = 0.0013); however, it has no association with genome size when body mass is kept constant (partial rank correlation coefficient rsp = –0.31, p = 0.0014).
