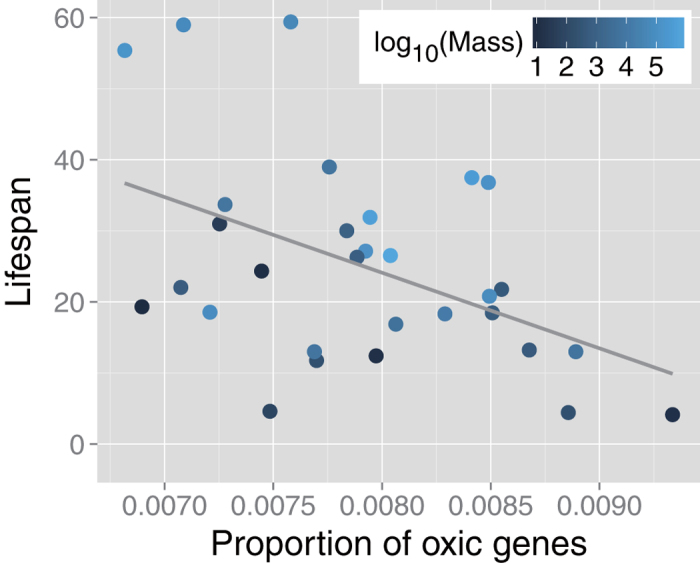
Figure 3. Scatter plot of the proportion of oxic genes versus maximal lifespan.

Symbol color indicates base-10 logarithmic body mass. The solid line is a linear regression fit to the data. Both simple rank correlation analysis (rs = –0.42, p = 0.021) and partial rank correlation analysis (rsp = –0.63, p = 1.8 × 10⁻⁵), in which body mass is kept constant, indicate a positive association the proportion of oxic genes between the mass-specific rate.
