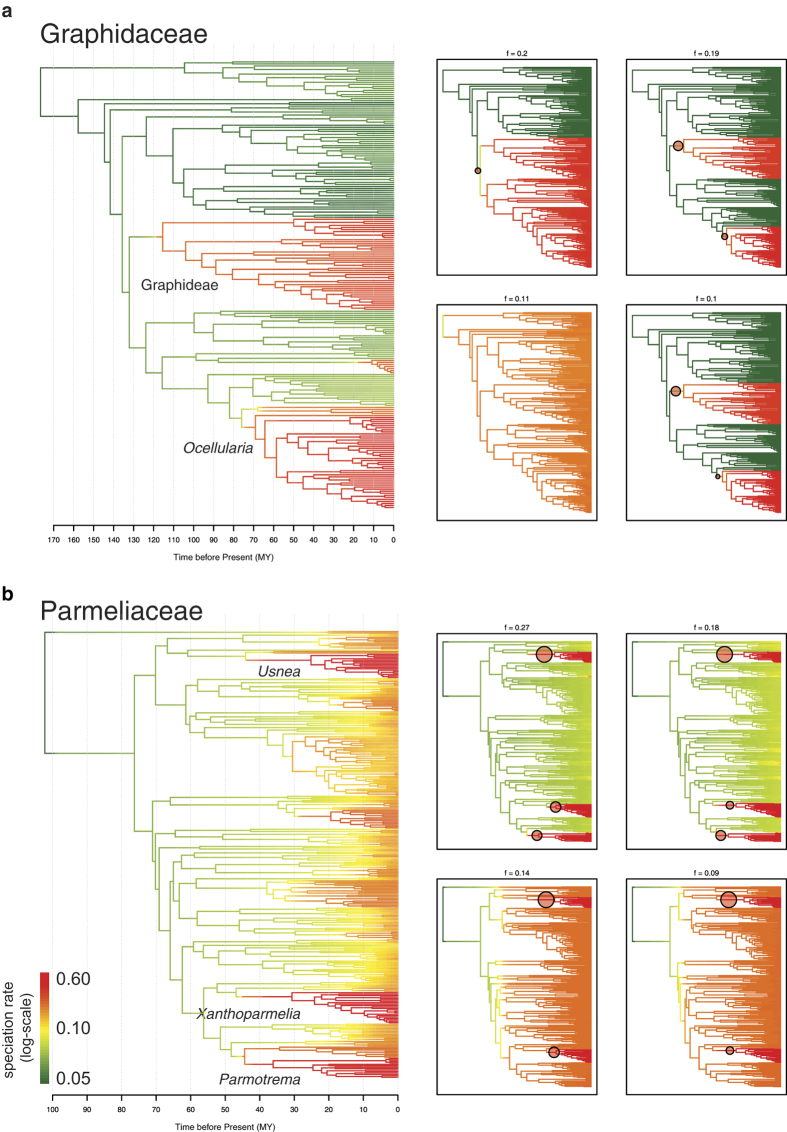
Figure 1.
Phylorate plots of lichenized fungal families Graphidaceae (a) and Parmeliaceae (b). The colours indicate relative speciation rate on each branch on the maximum clade credibility tree. Four panels on the right depict four most common rate shift configurations from the 95% credible shift set with the locations of rate shift indicated by red circles.

