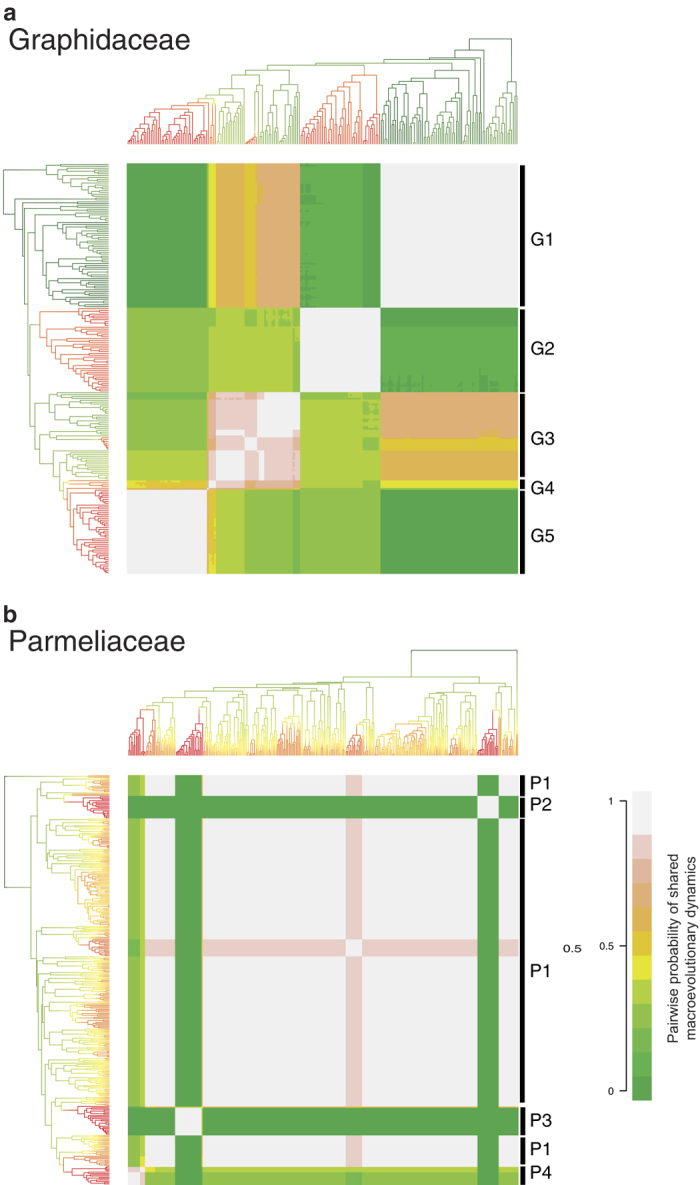
Figure 2.

Cohort analyses of lichenized fungal families Graphidaceae (a) and Parmeliaceae (b). The colours indicate a relative pairwise similarity between speciation rates of two tips across the tree (1 = most similar, 0 = most dissimilar). The letter codes on the right denote different “diversification regimes” in the family.
